GenSigma is our high-flyer strategy designed for daring souls. Trades leveraged ETFs such as TQQQ, UGL, etc.
Backtested Performance Metrics
GenSigma vs. S&P 500/Nasdaq-100
Jan 1, 2019 to Oct 31, 2025
*SPY is the SPDR S&P 500 ETF Trust, which tracks the S&P 500 index | QQQ is the Invesco QQQ Trust, which tracks the Nasdaq-100 Index
GenSigma Annual Returns vs. Benchmarks (SPY & QQQ)
SPY ETF tracks S&P 500 index | QQQ ETF tracks Nasdaq-100 Index
*2025 performance is hypothetical YTD as of September 30th, 2025. Past performance does not guarantee future results.
Performance Data & Analysis
Detailed historical performance metrics and investment growth analysis.
Hypothetical Investment Growth
Growth of $10,000 invested in SPY, QQQ, or GenSigma.
*2025 performance is hypothetical YTD as of September 30th, 2025. Past performance does not guarantee future results.
Annual Performance vs. Benchmarks
Year-over-year returns comparison.
*2025 performance is hypothetical YTD as of September 30th, 2025. Past performance does not guarantee future results.
GenSigma Performance Analysis
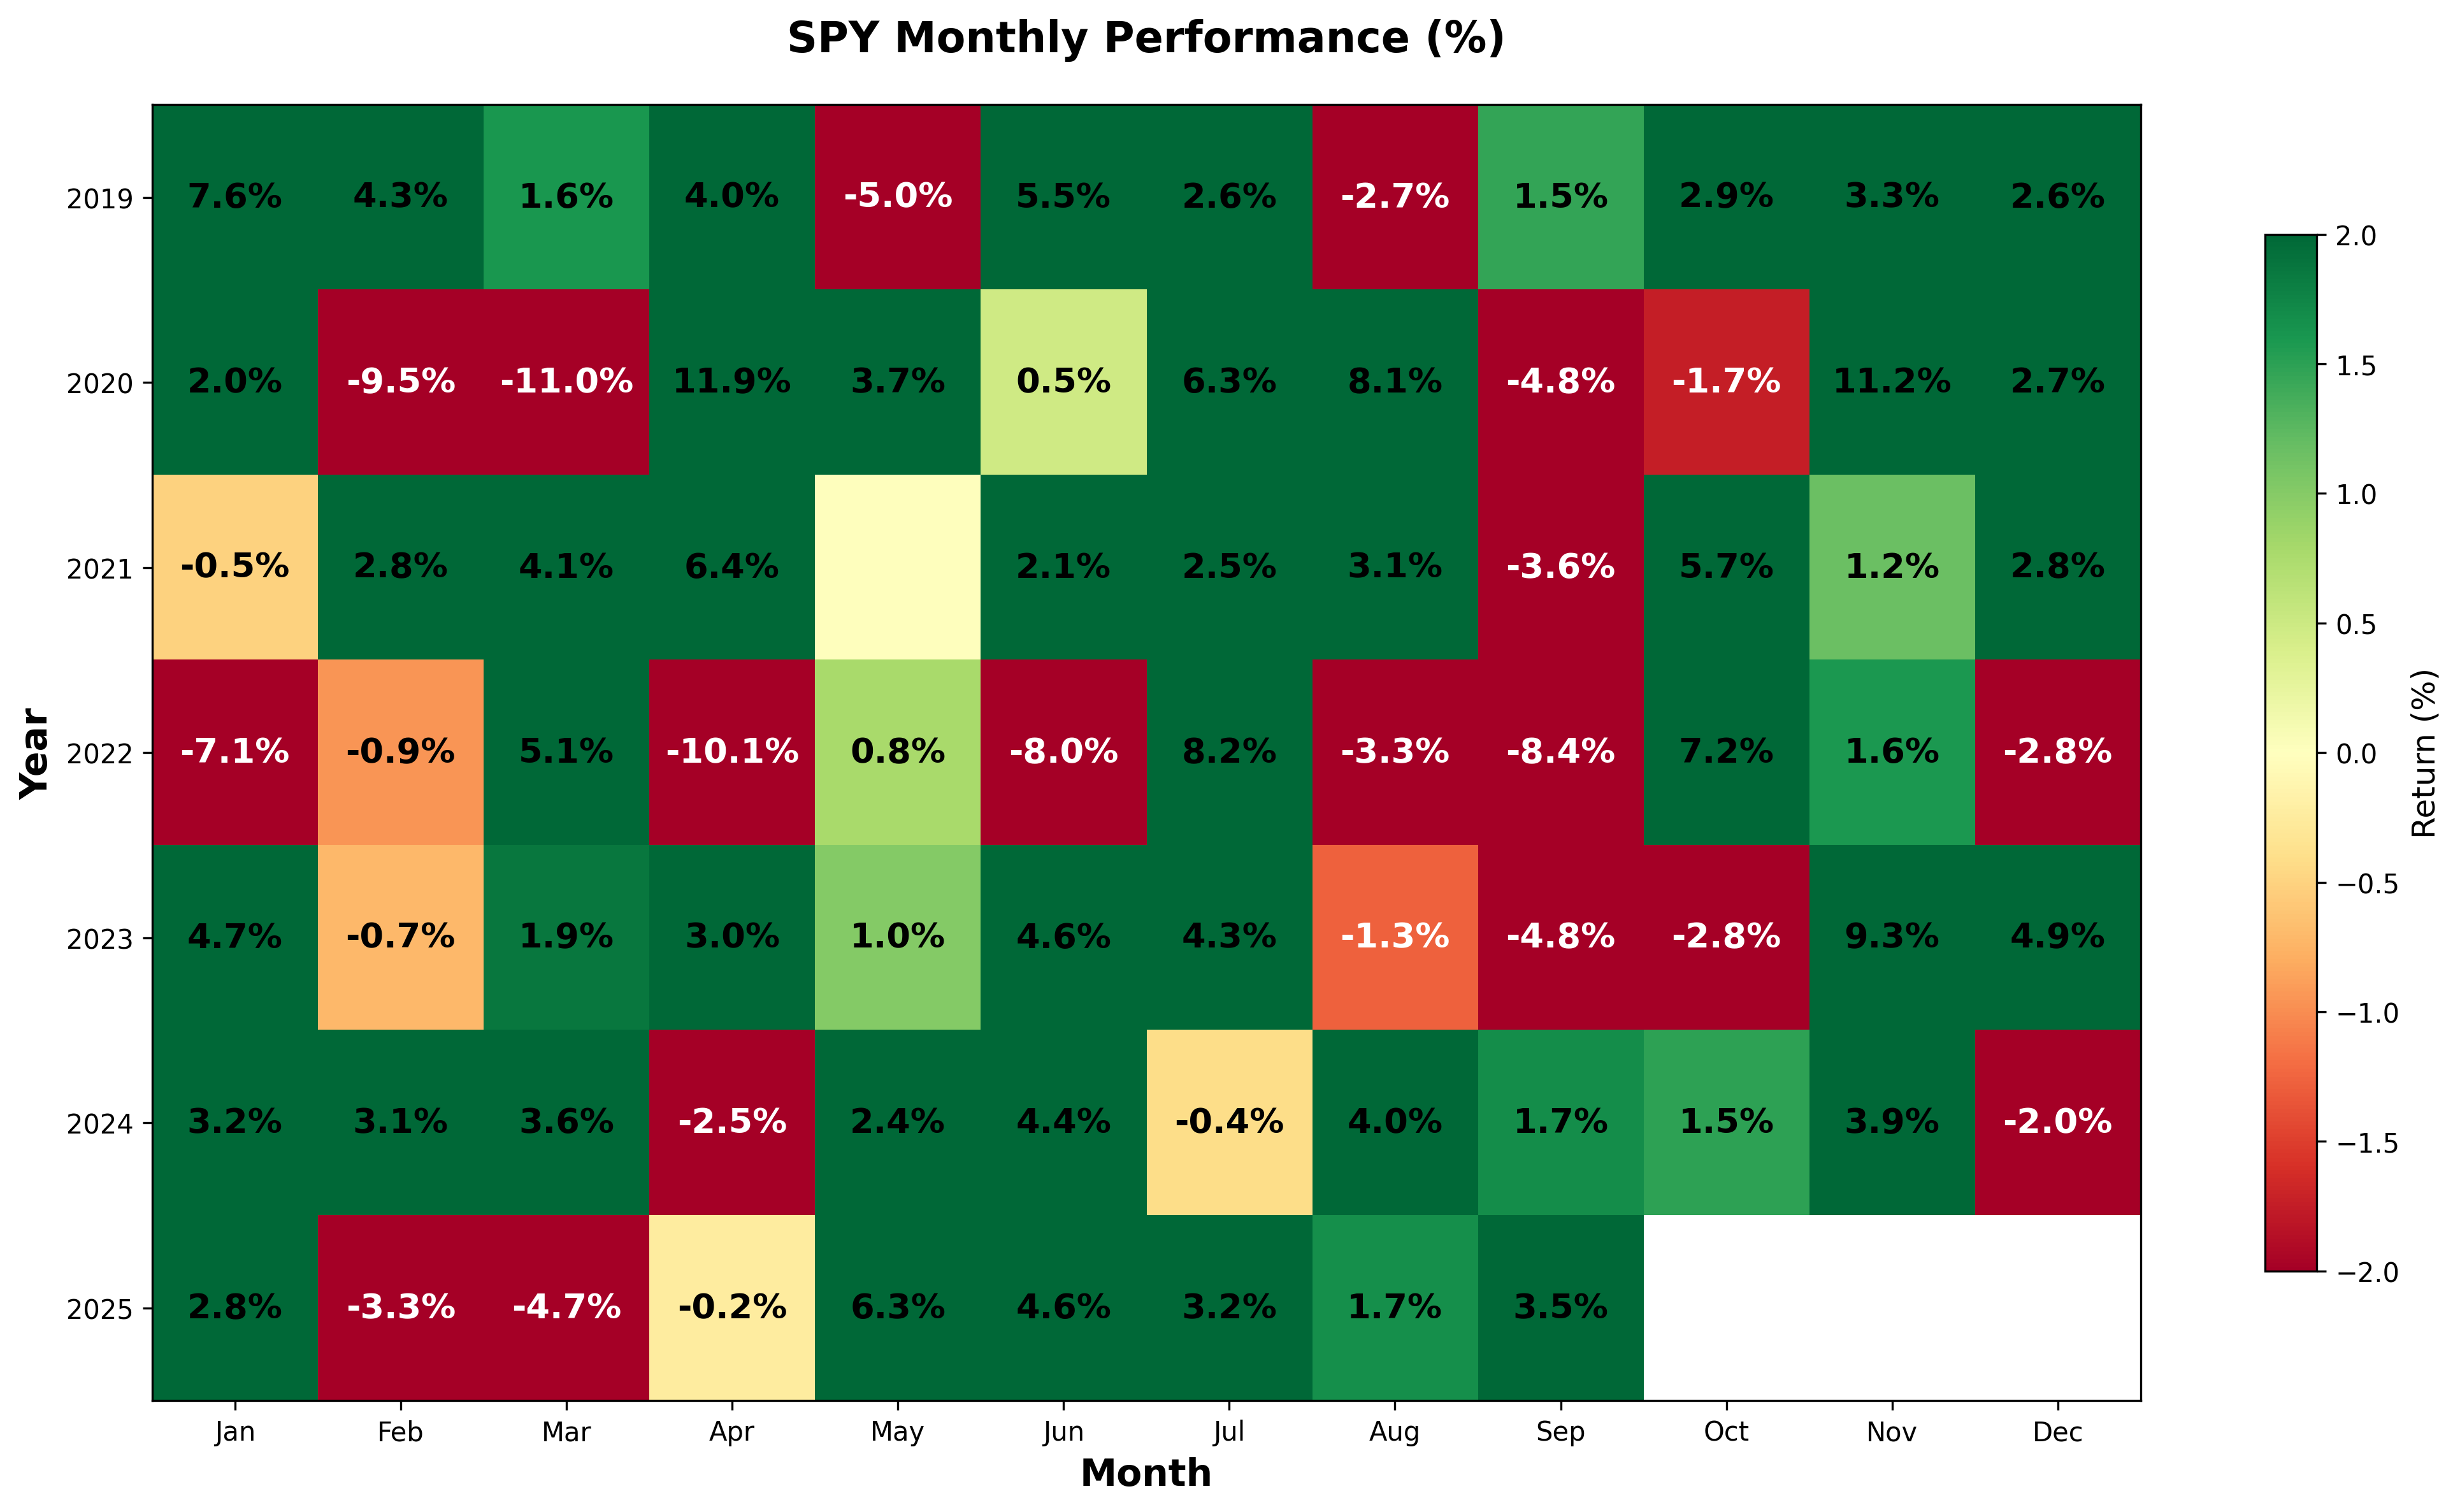
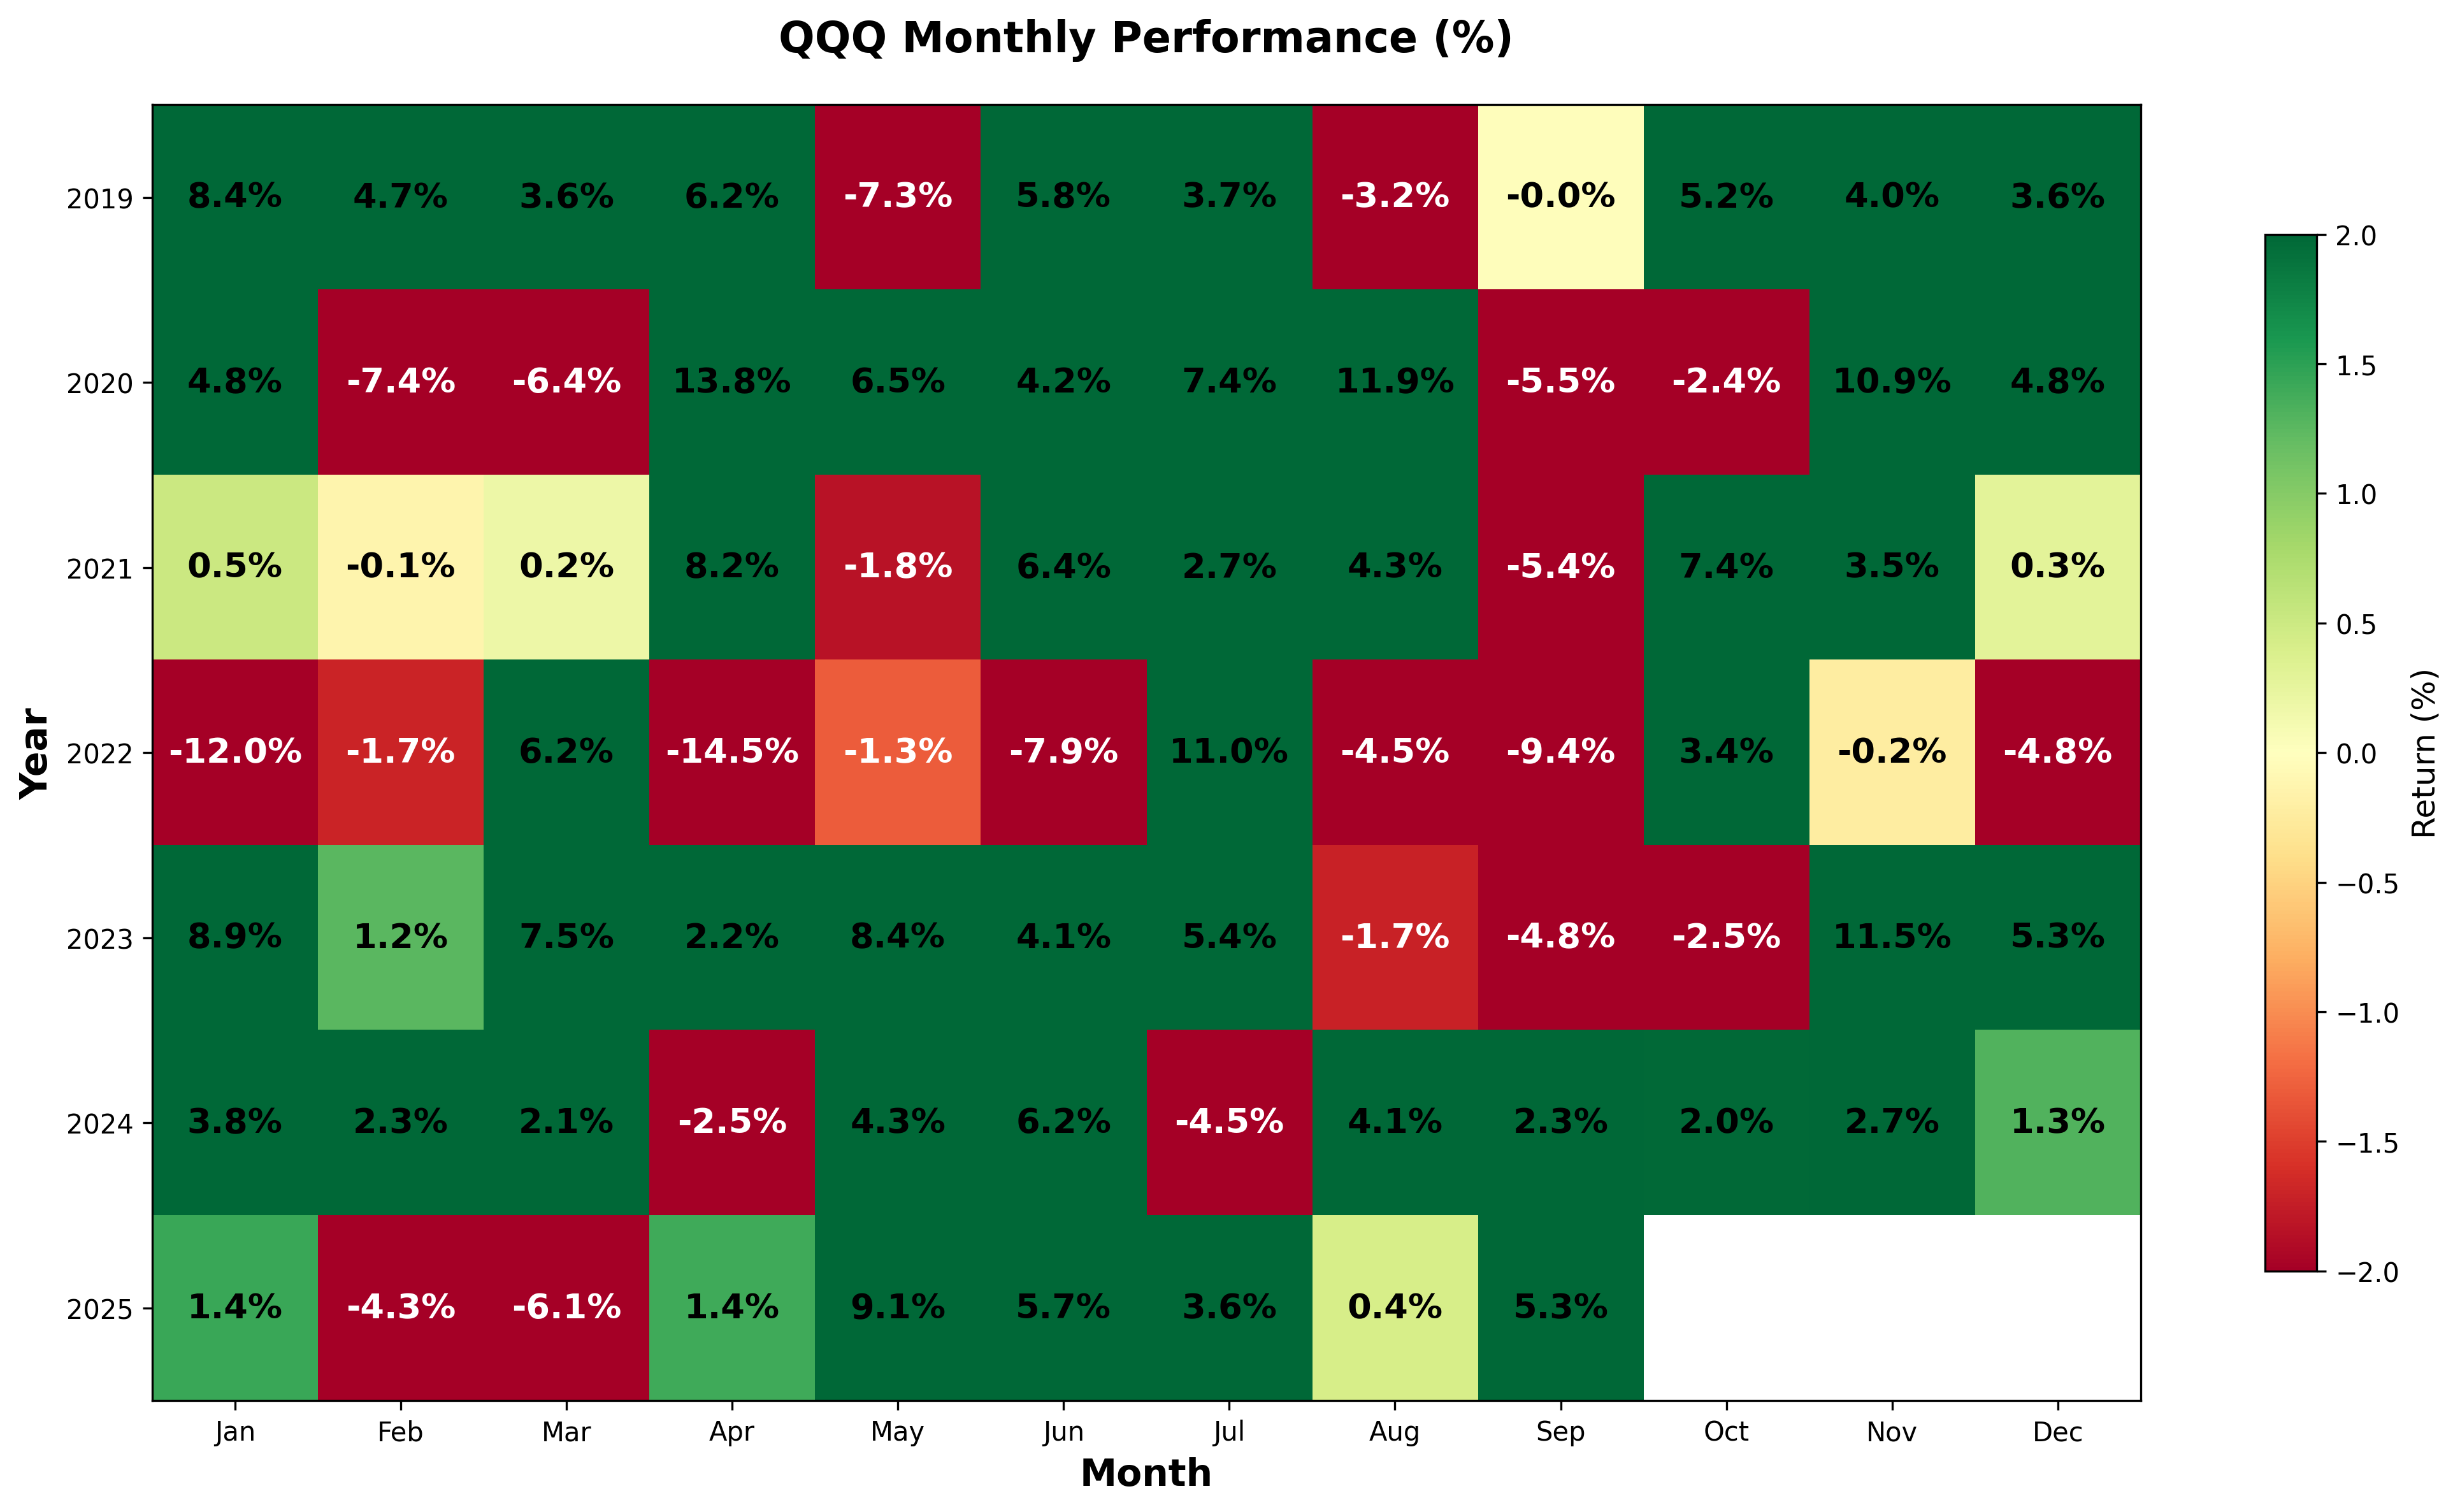
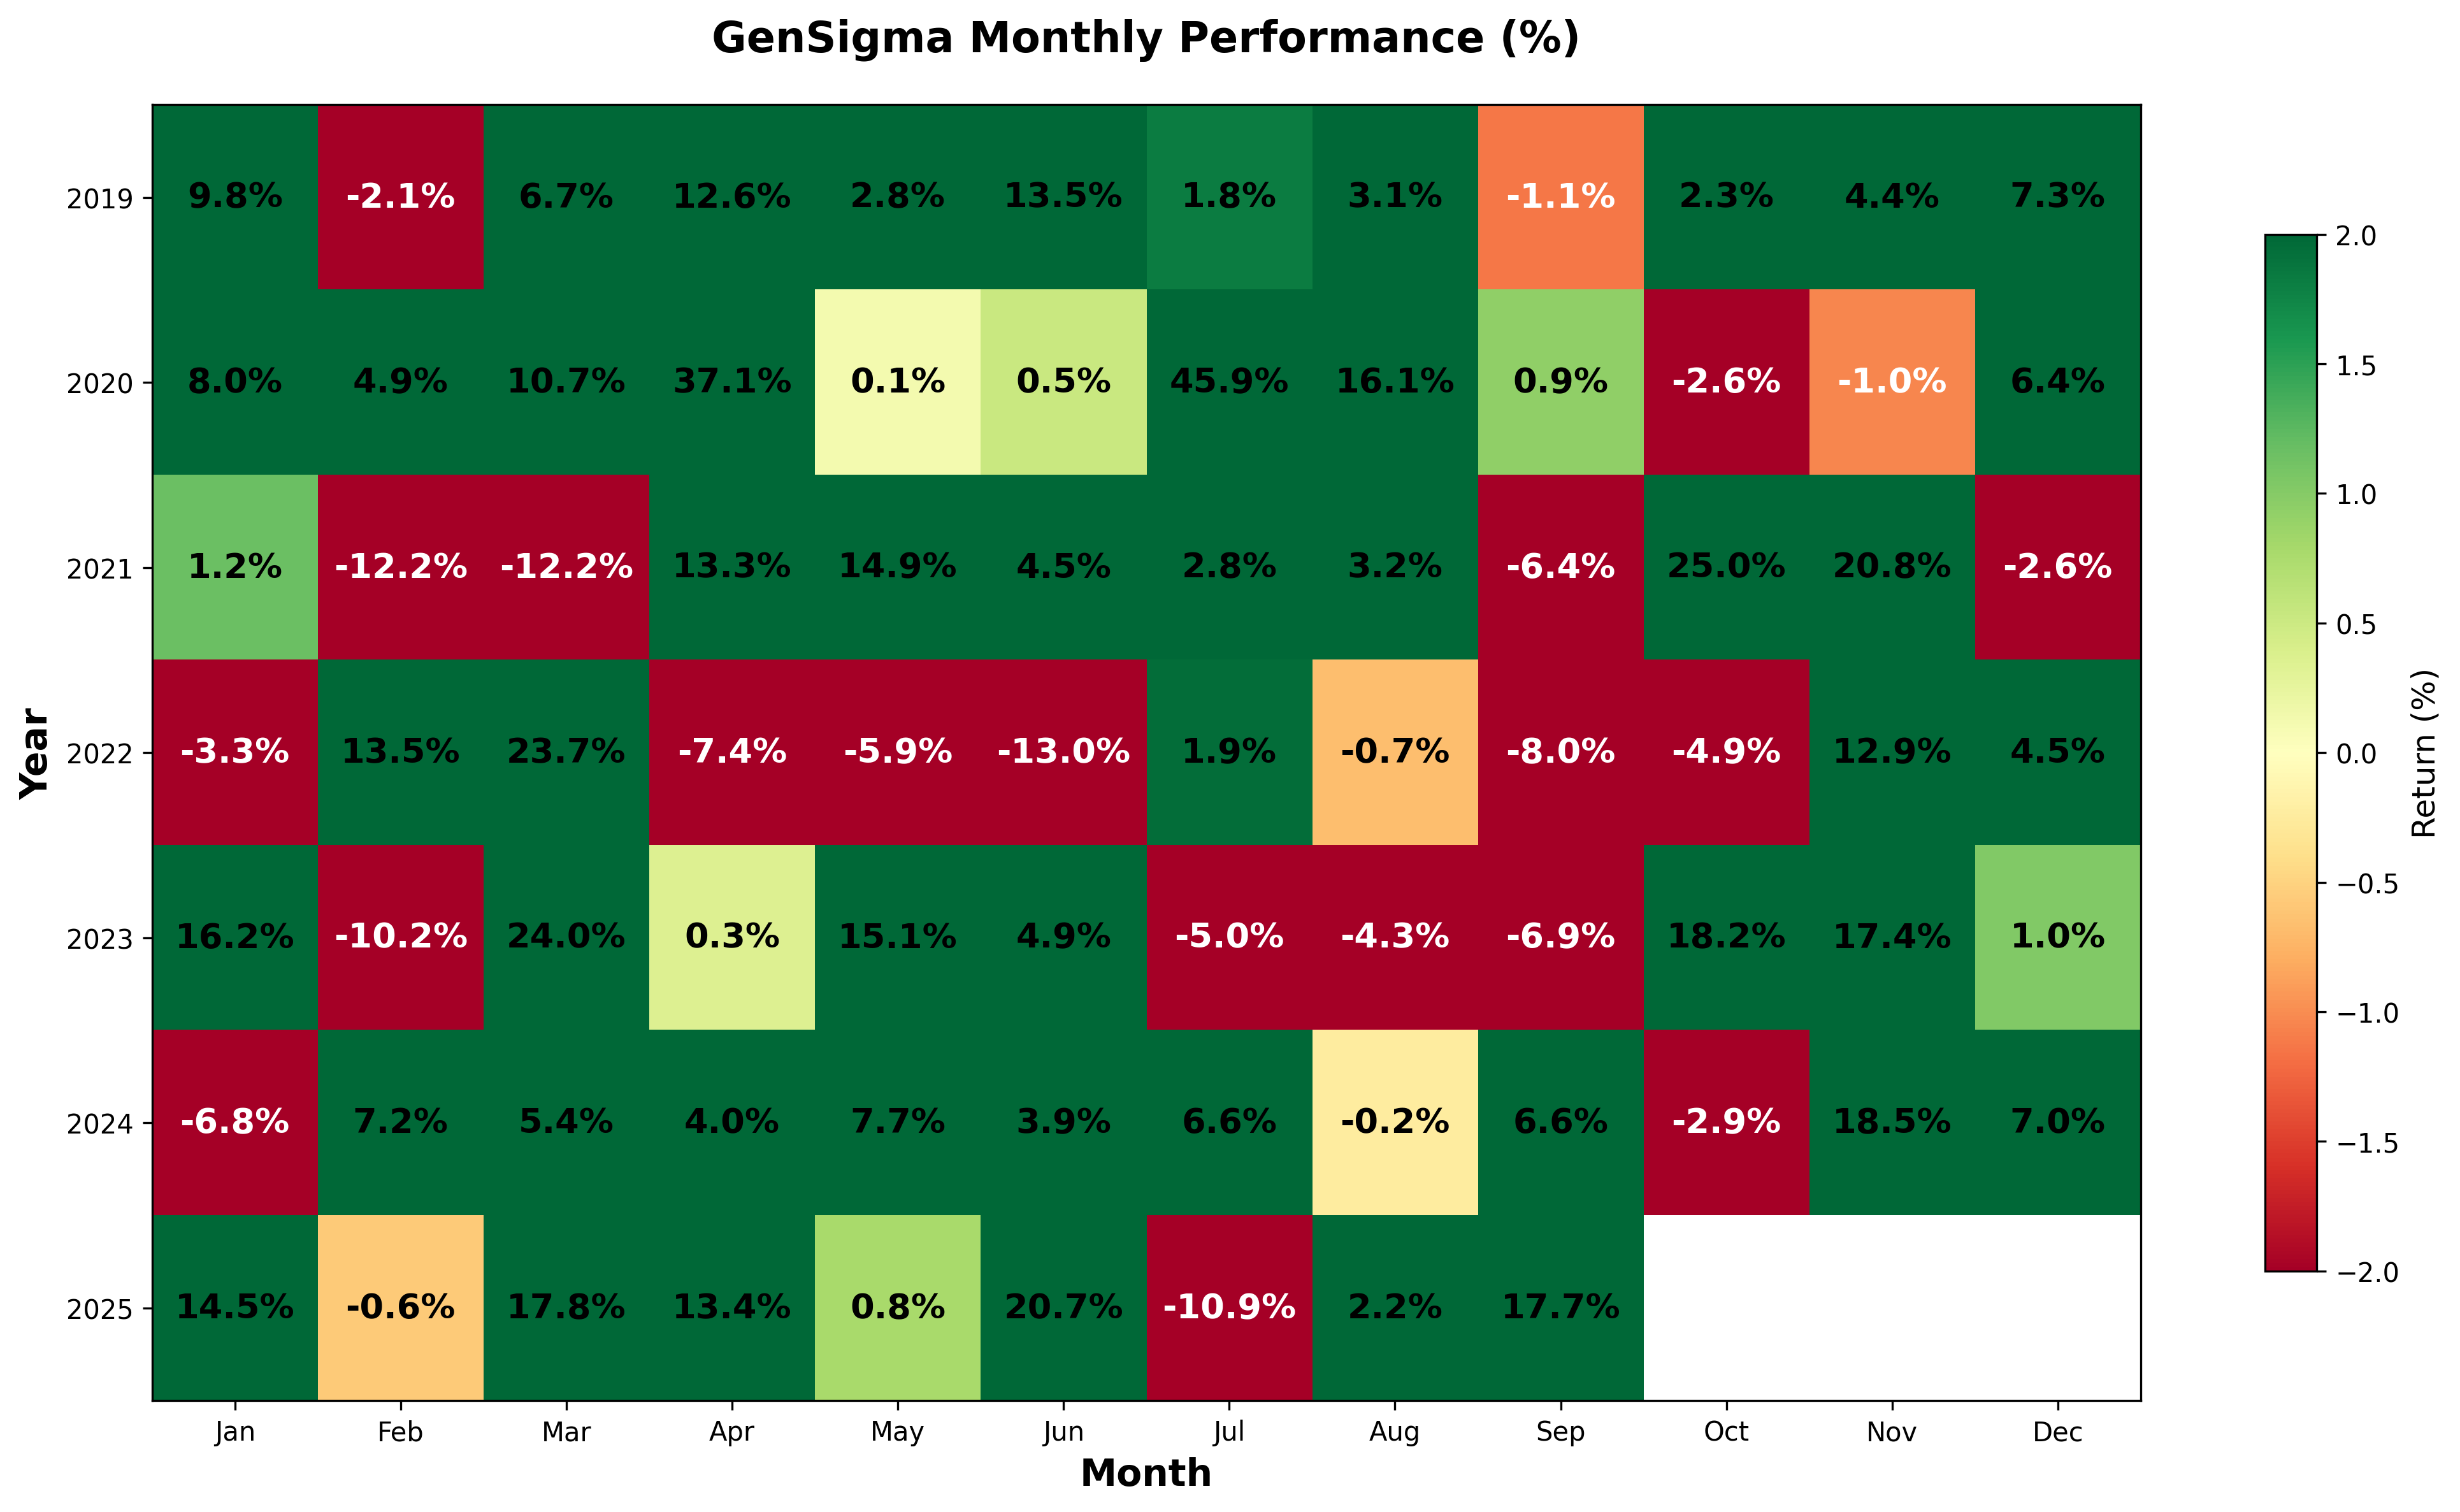
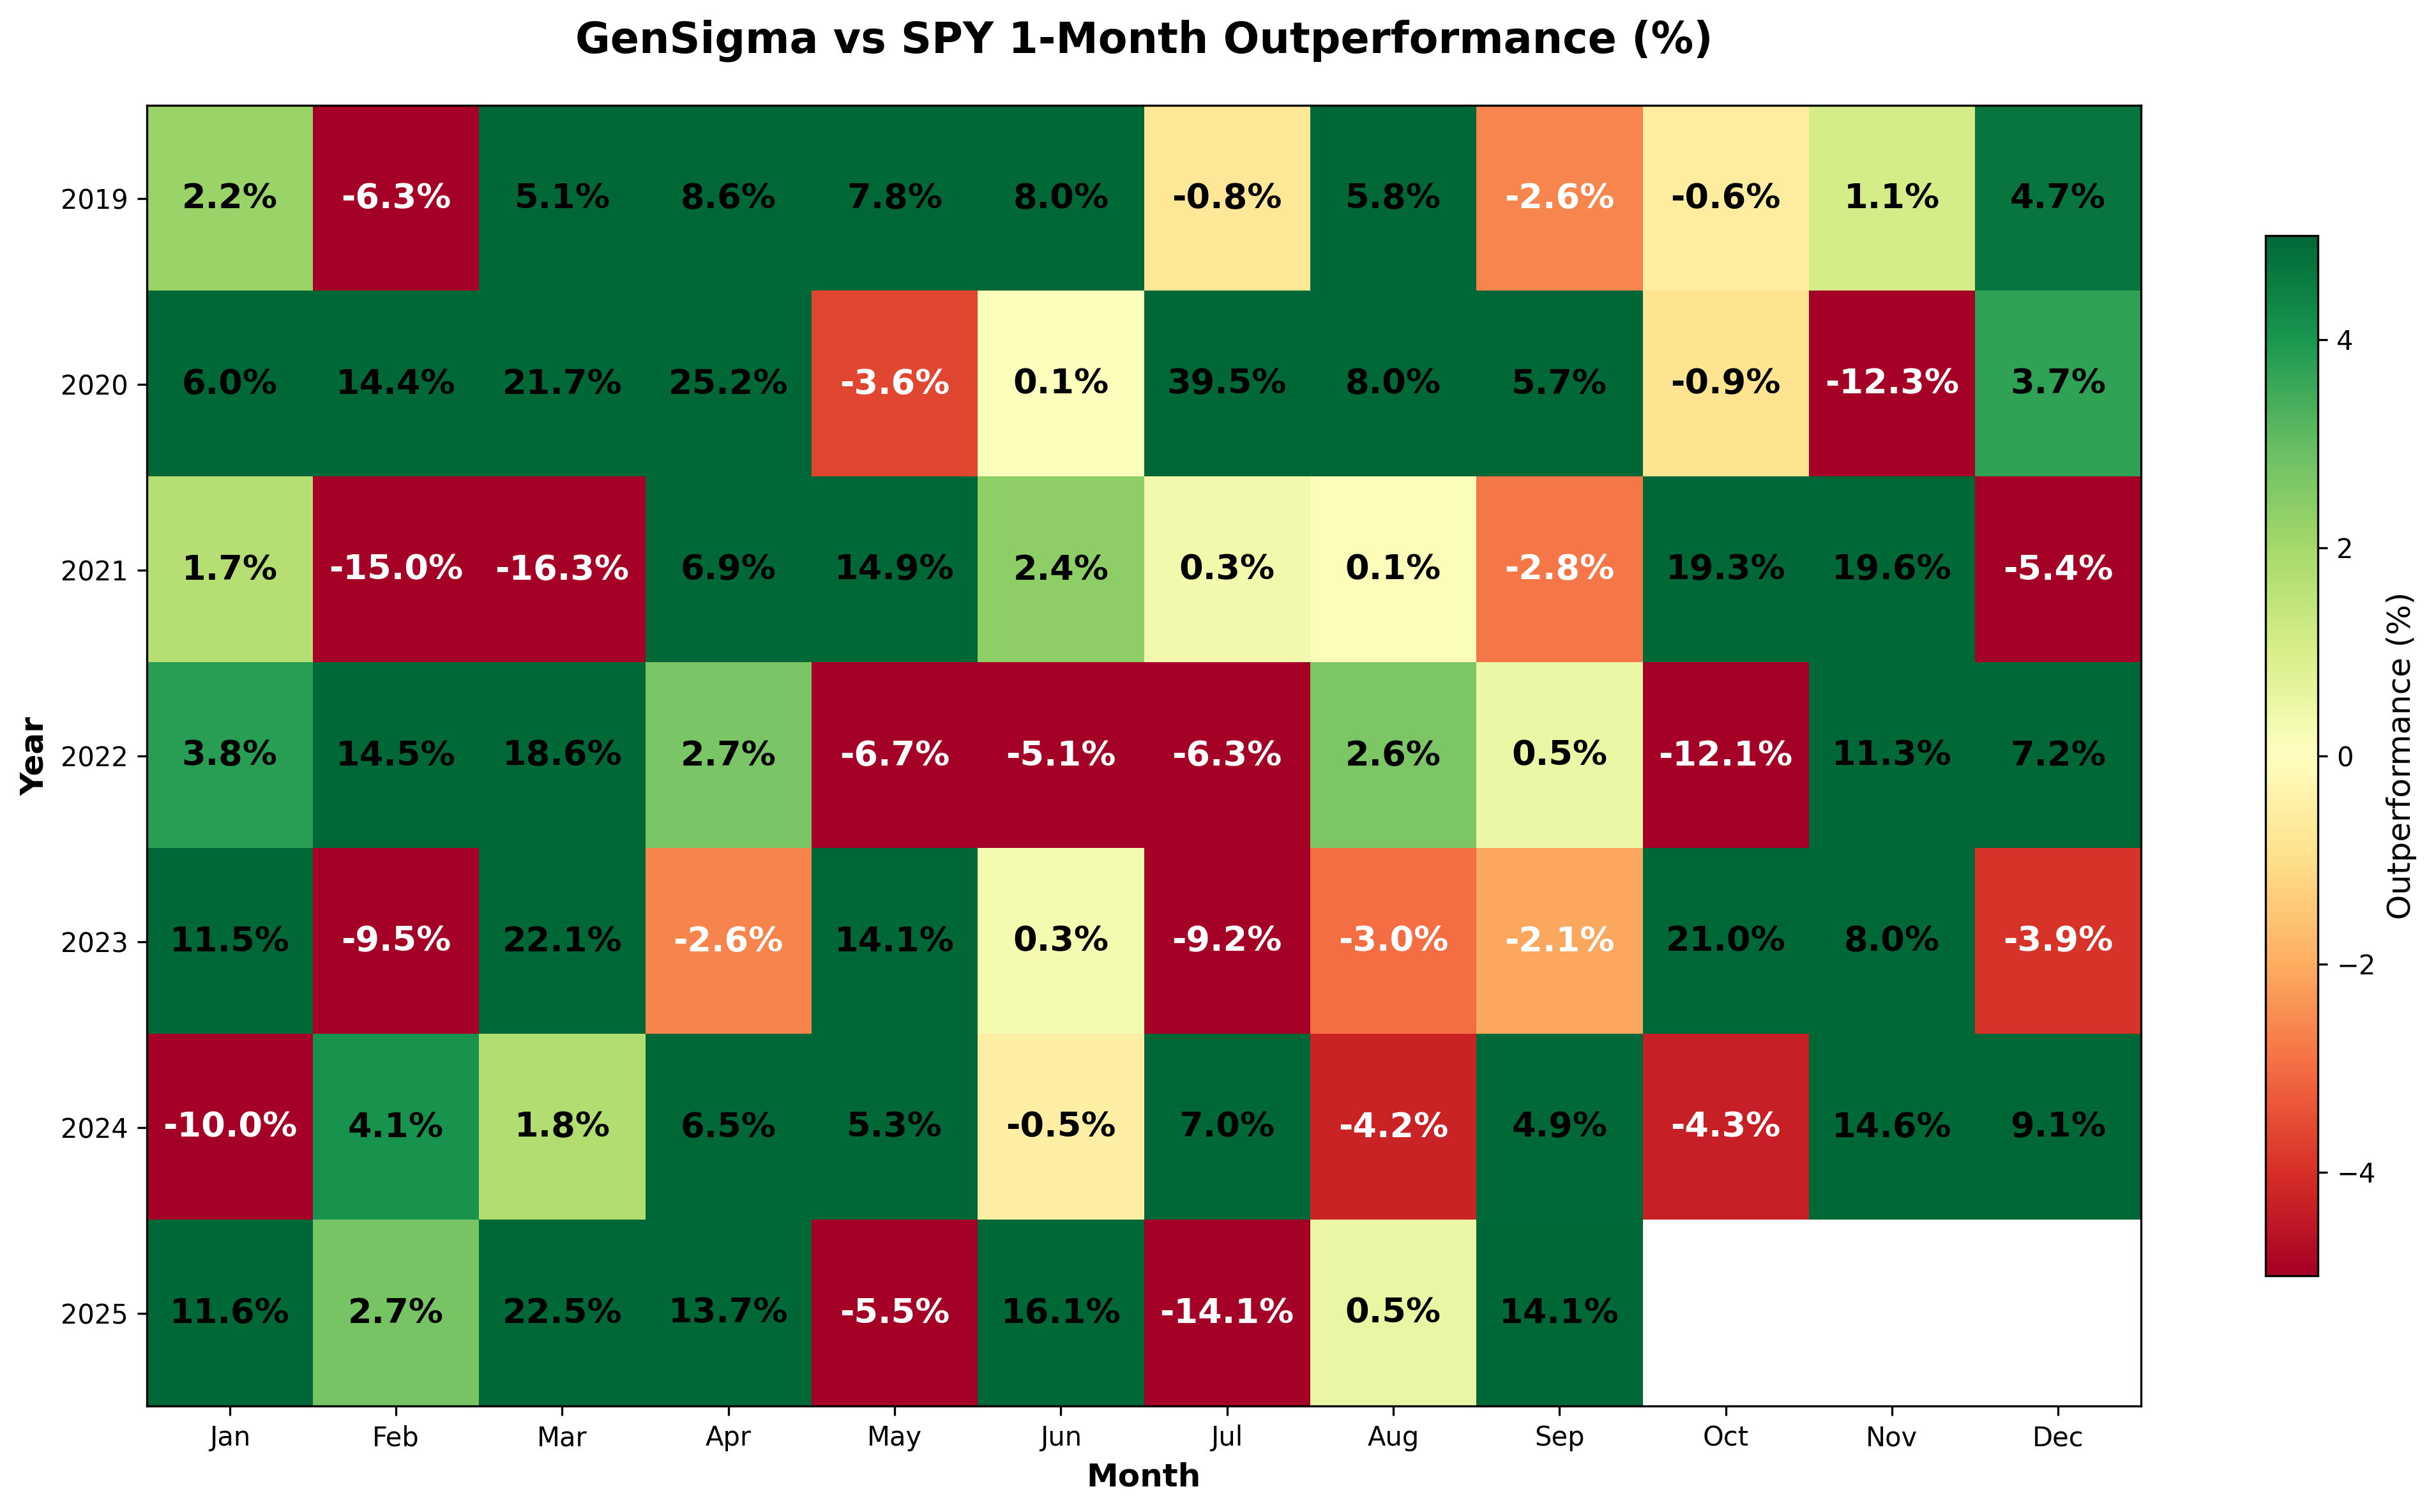
GenSigma - 1-Month Performance Analysis
Click on the individual image to enlarge
How to Read These Charts: The individual portfolio charts show monthly returns for each strategy. The comparison charts (GenSigma vs Other Portfolio) display the difference in percentage returns between GenSigma and the other portfolio. A positive number indicates GenSigma performed better, while a negative number indicates the other portfolio performed better.
SPY
QQQ
GenSigma
GenSigma vs SPY
GenSigma vs QQQ
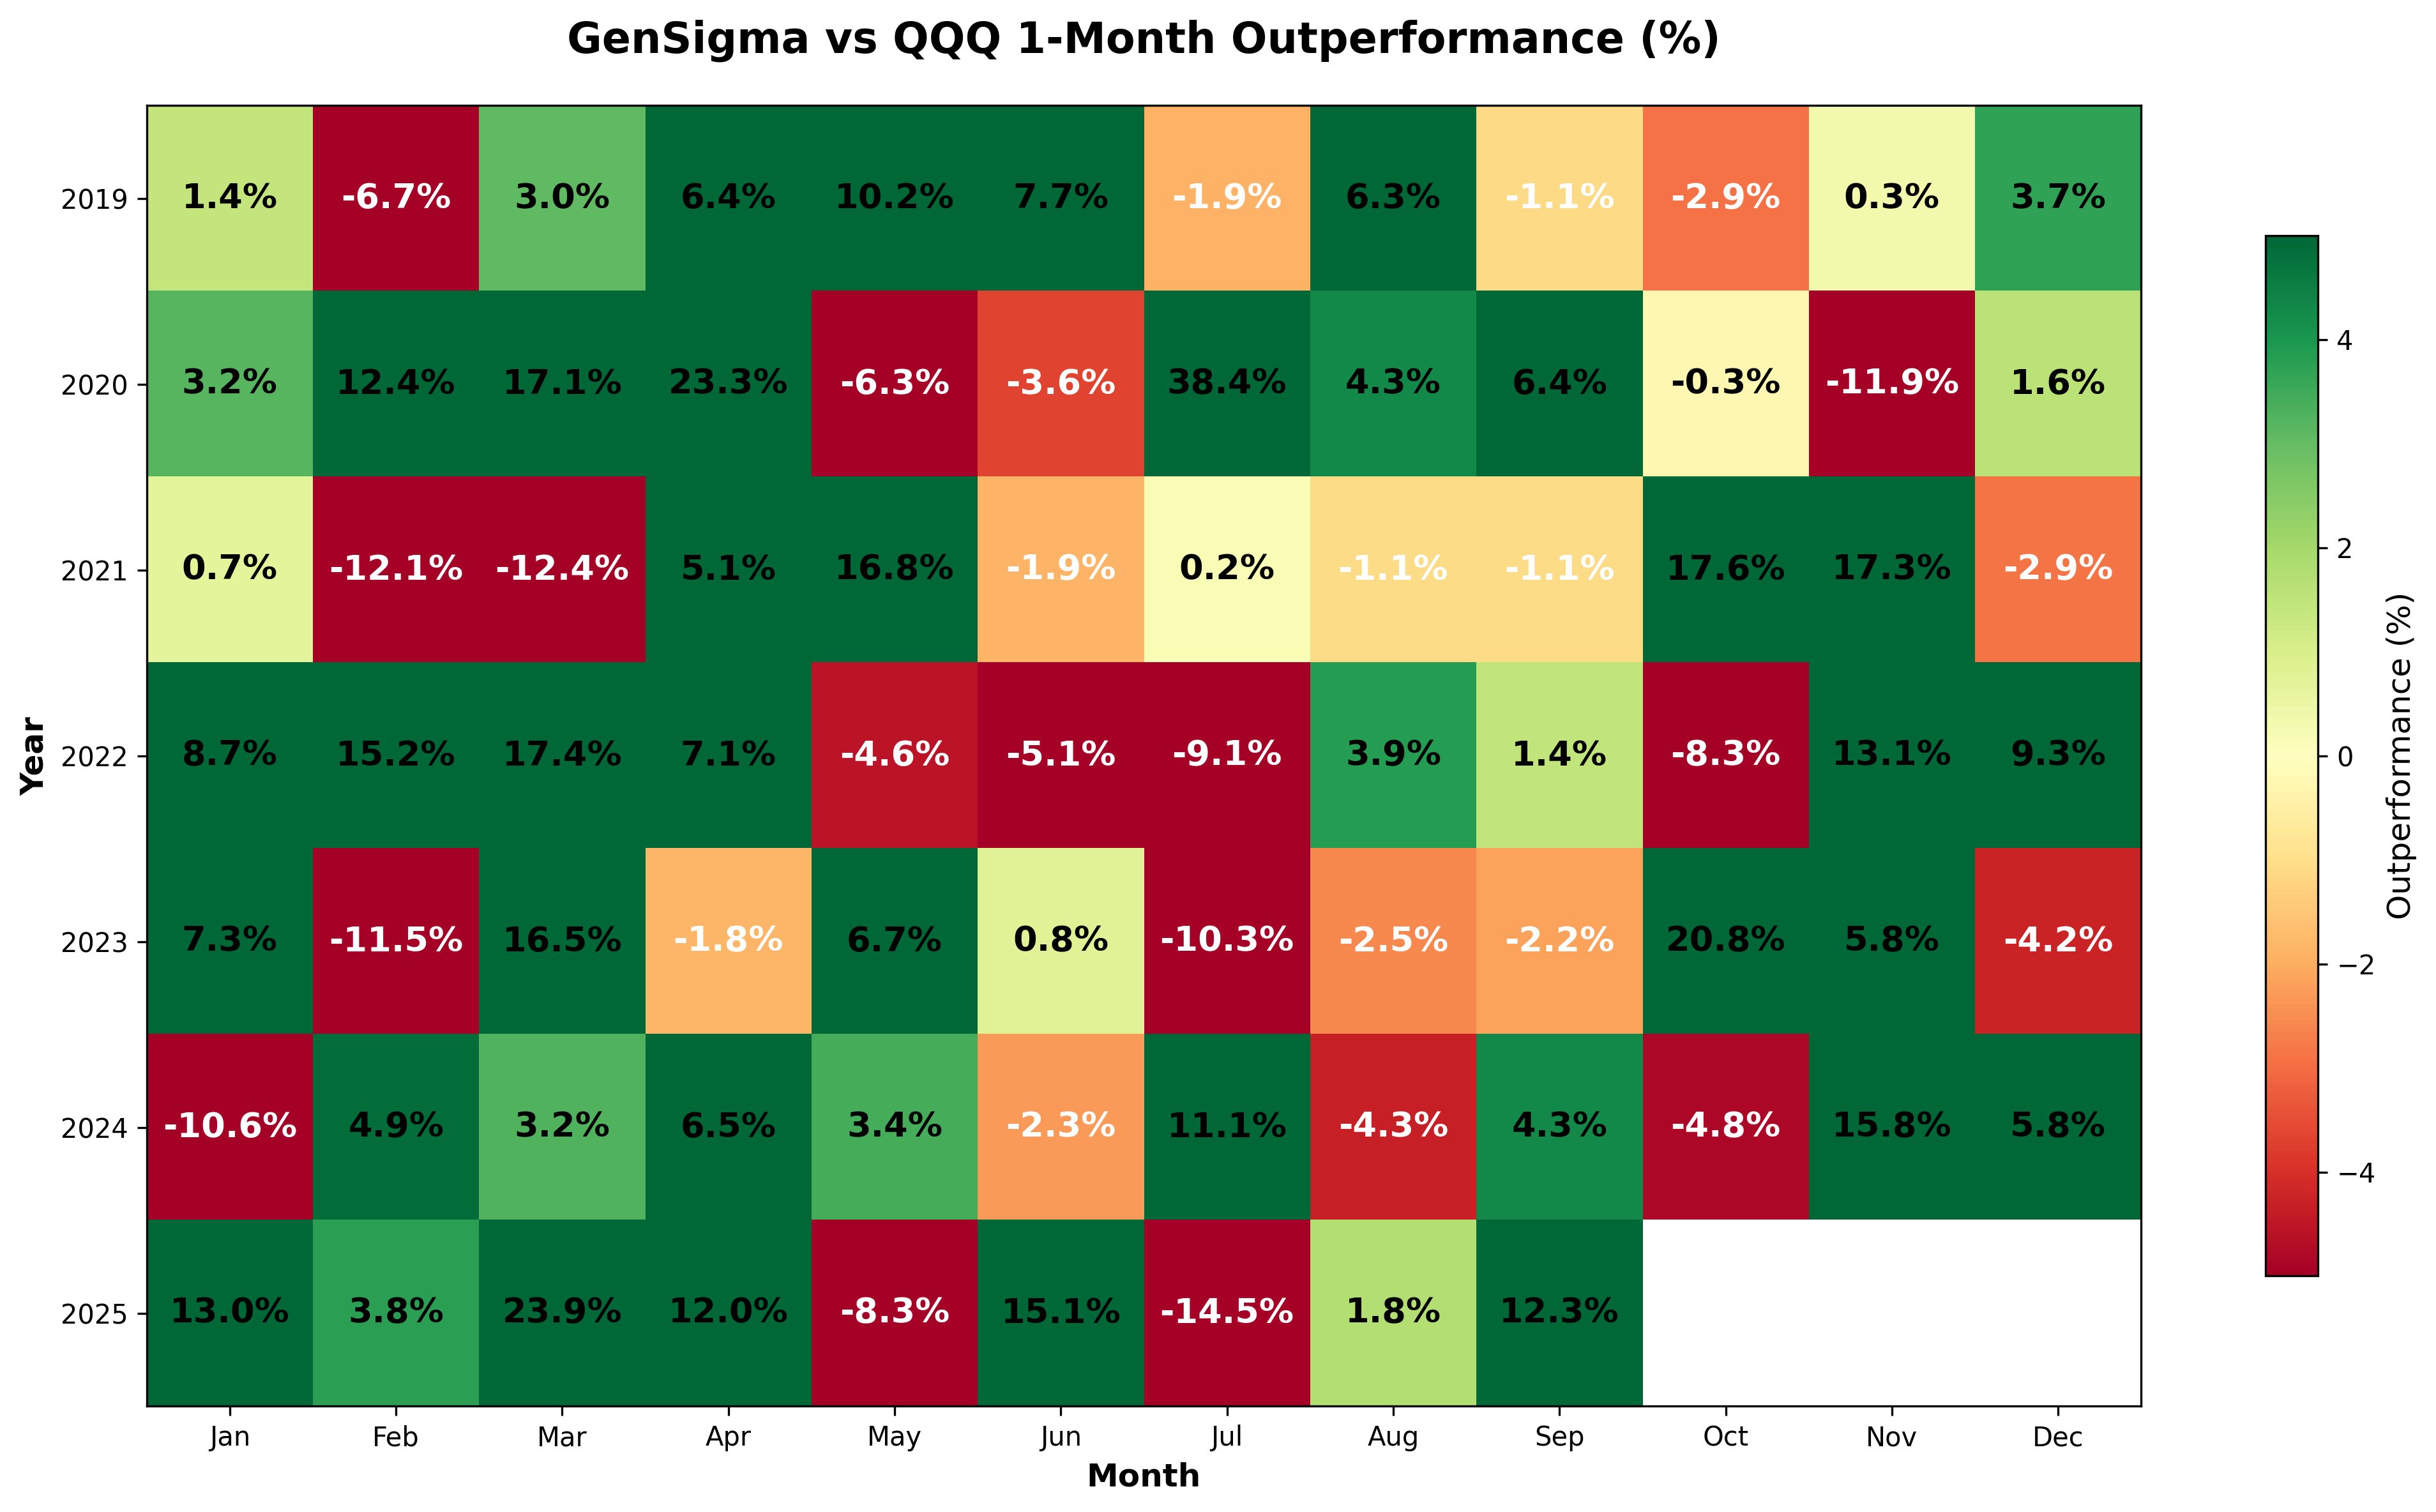
*2025 performance is hypothetical YTD as of September 30th, 2025. Past performance does not guarantee future results.
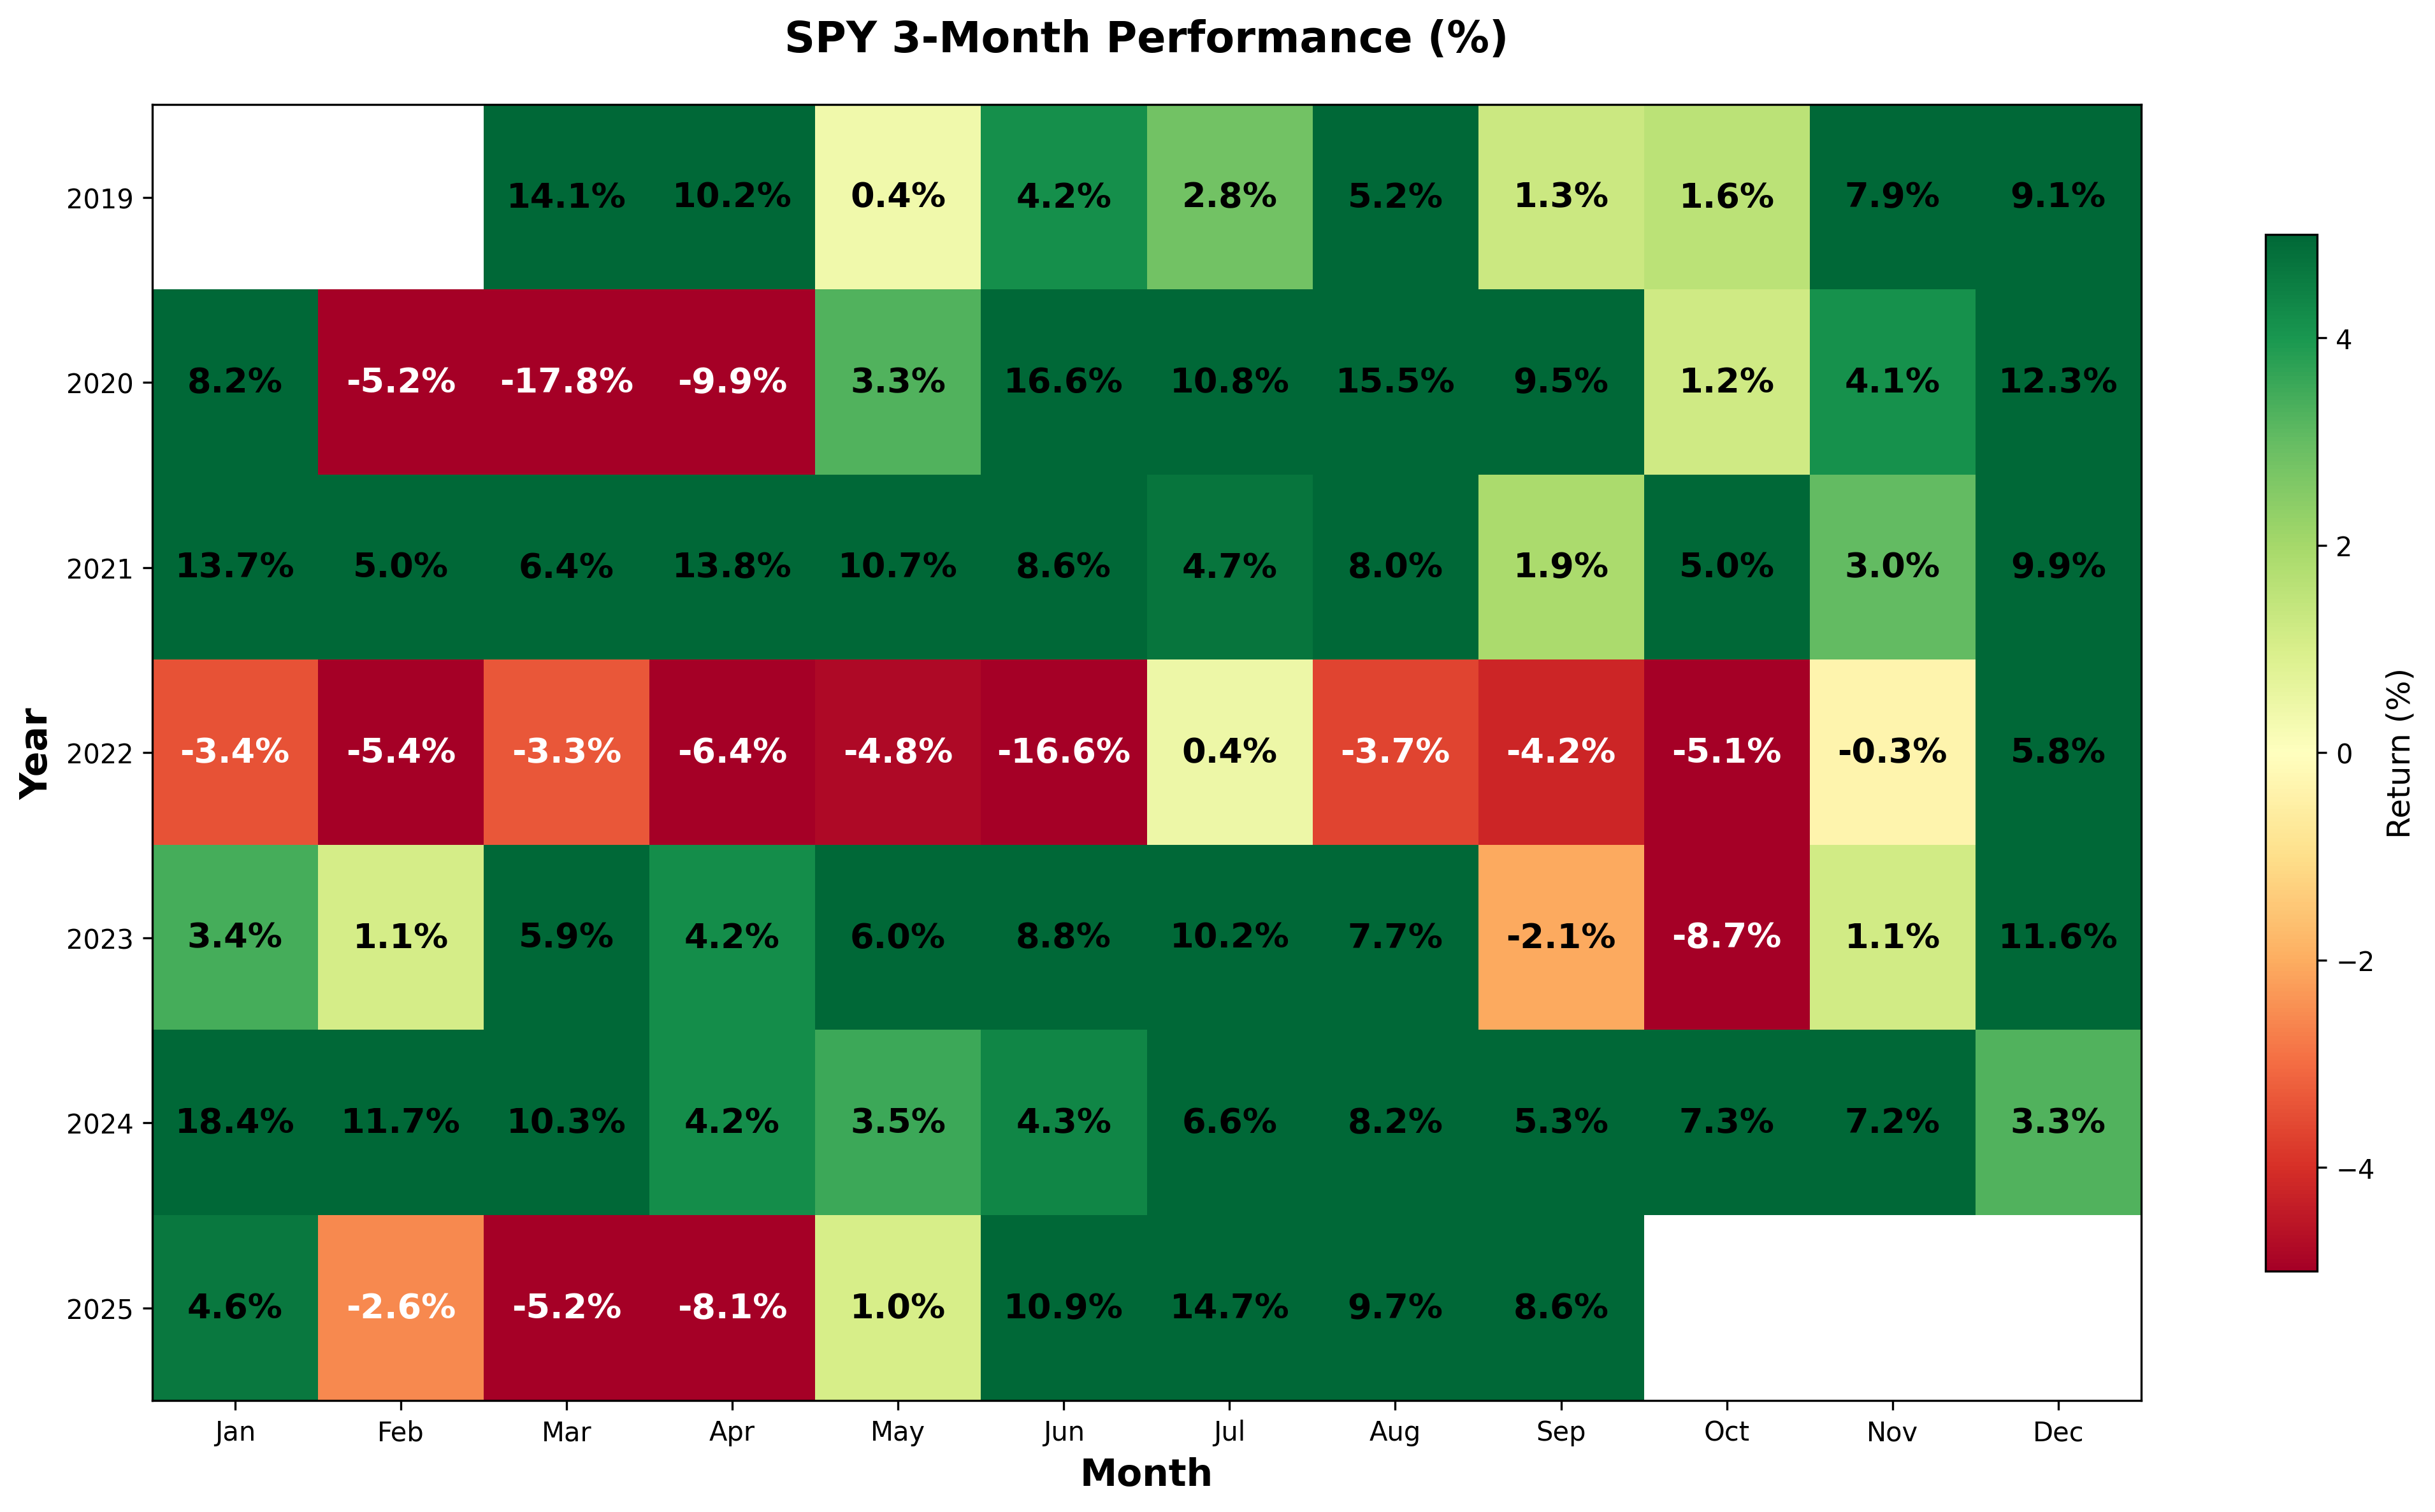
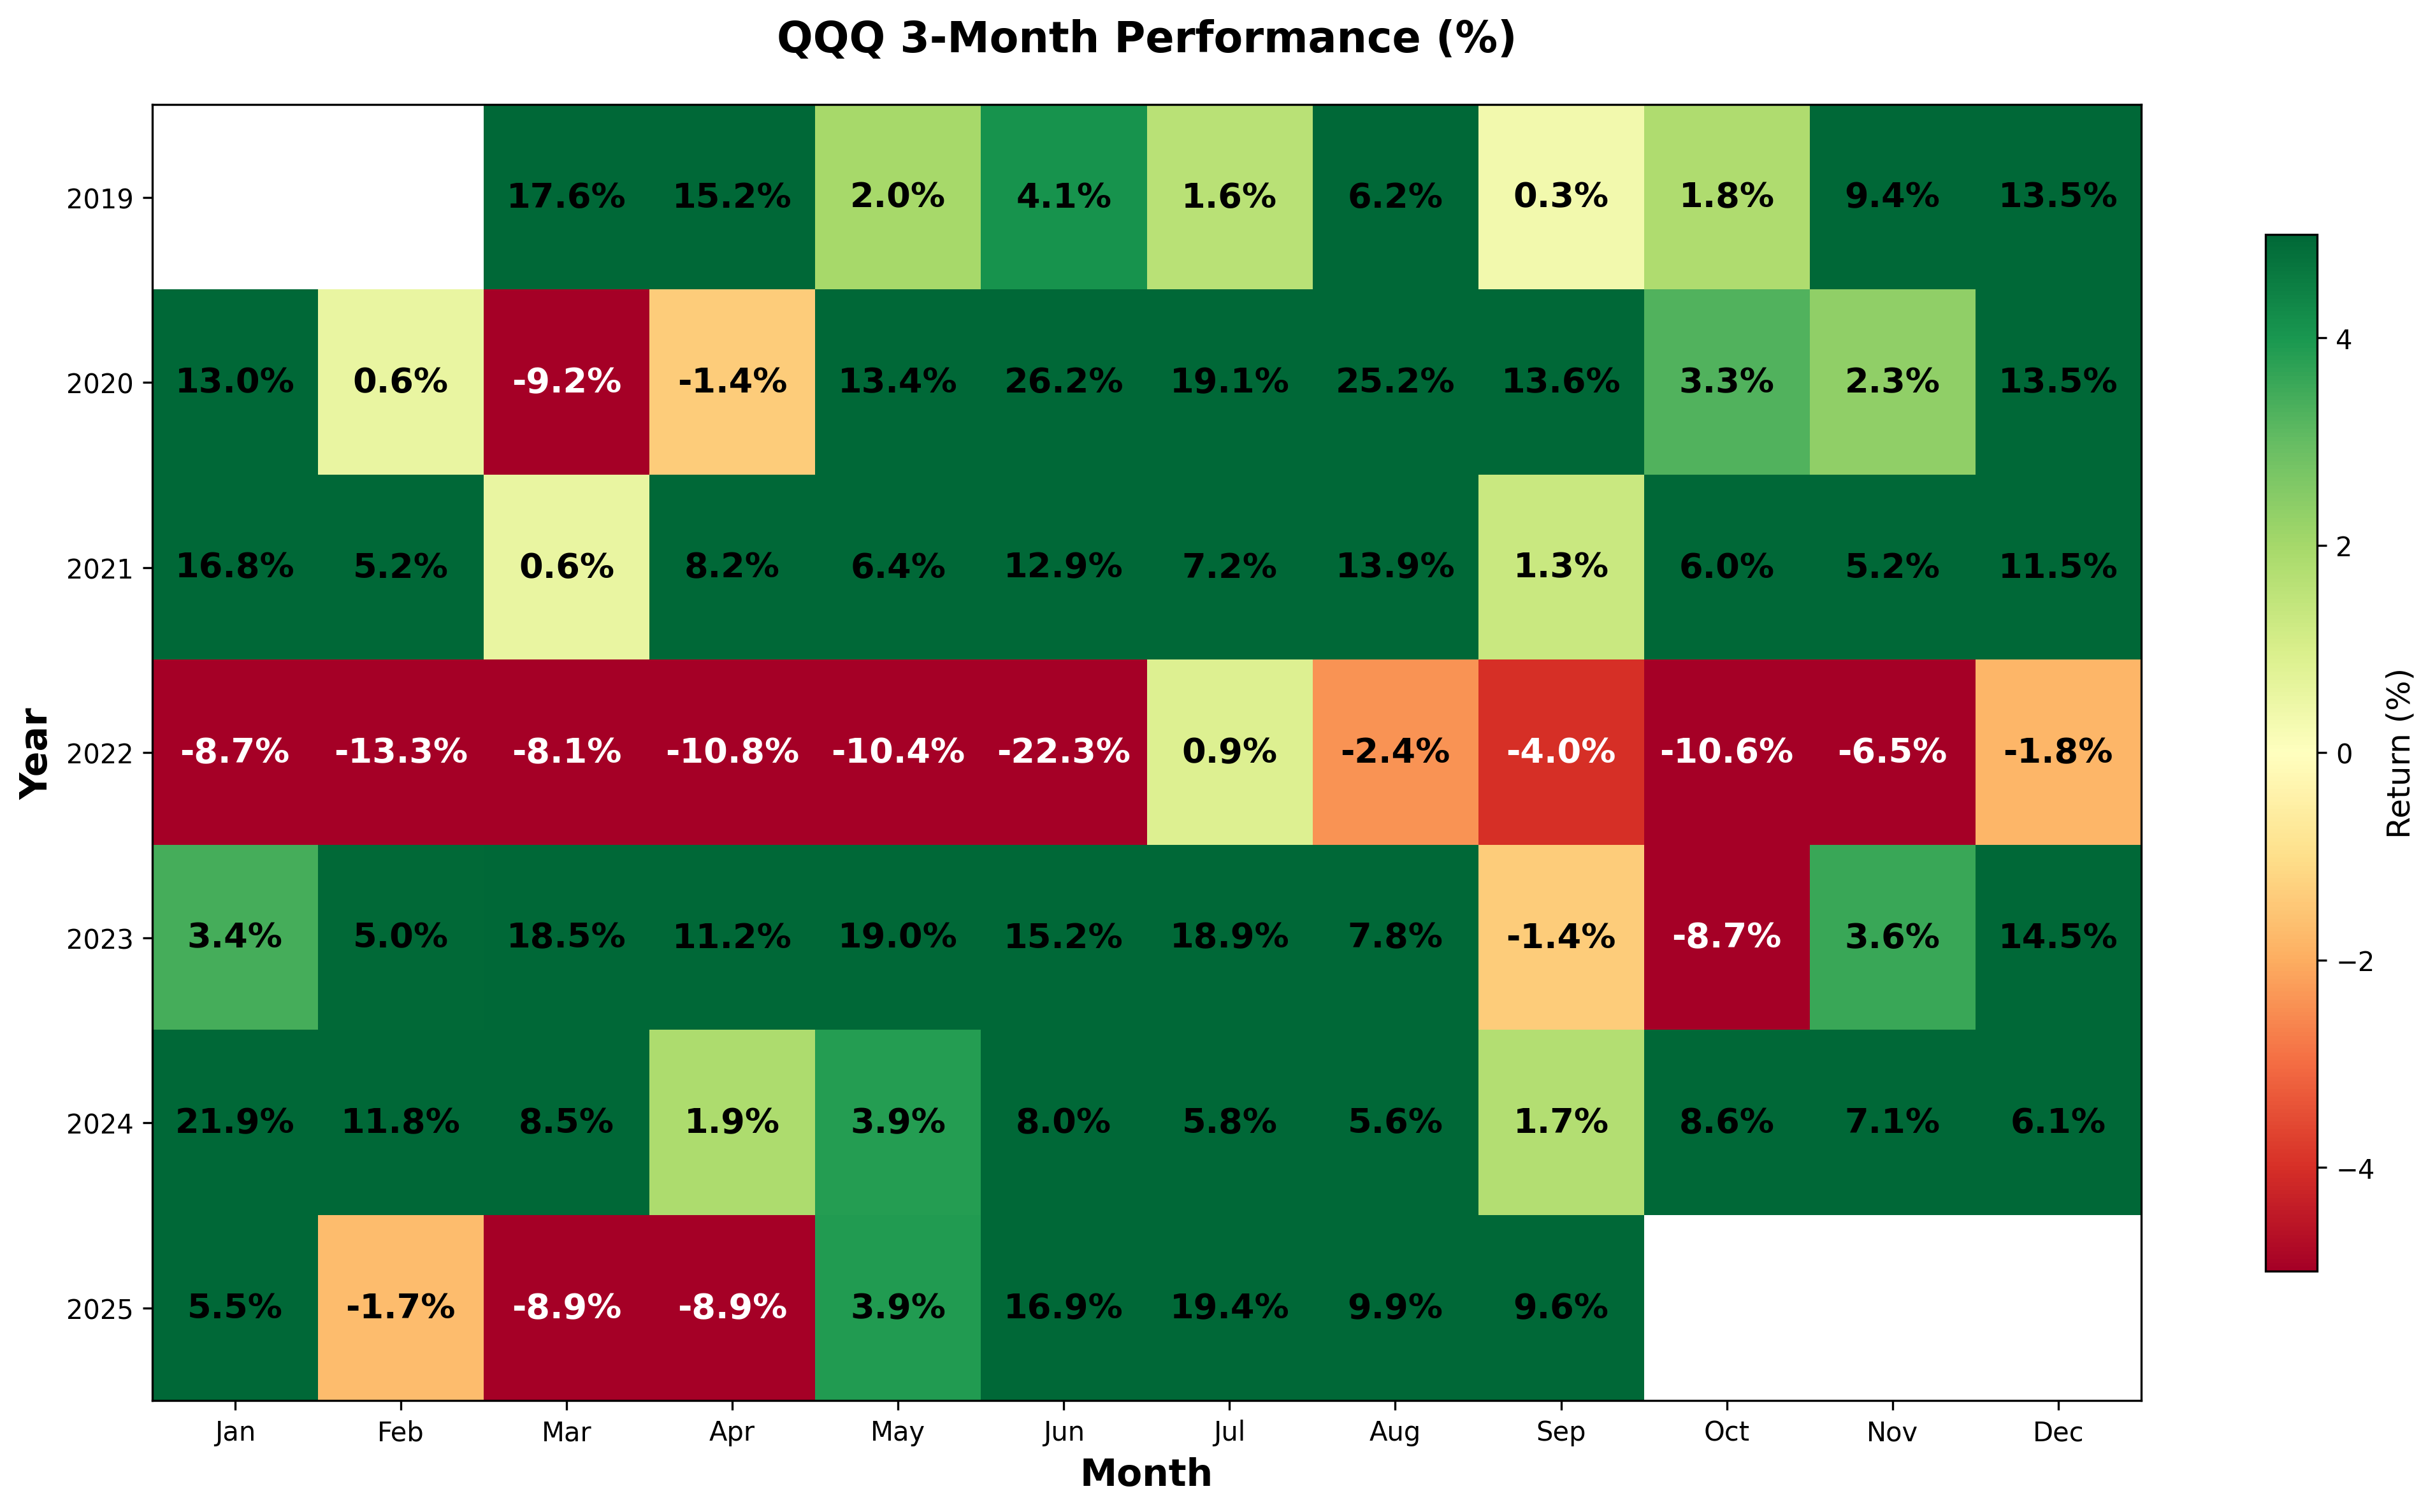
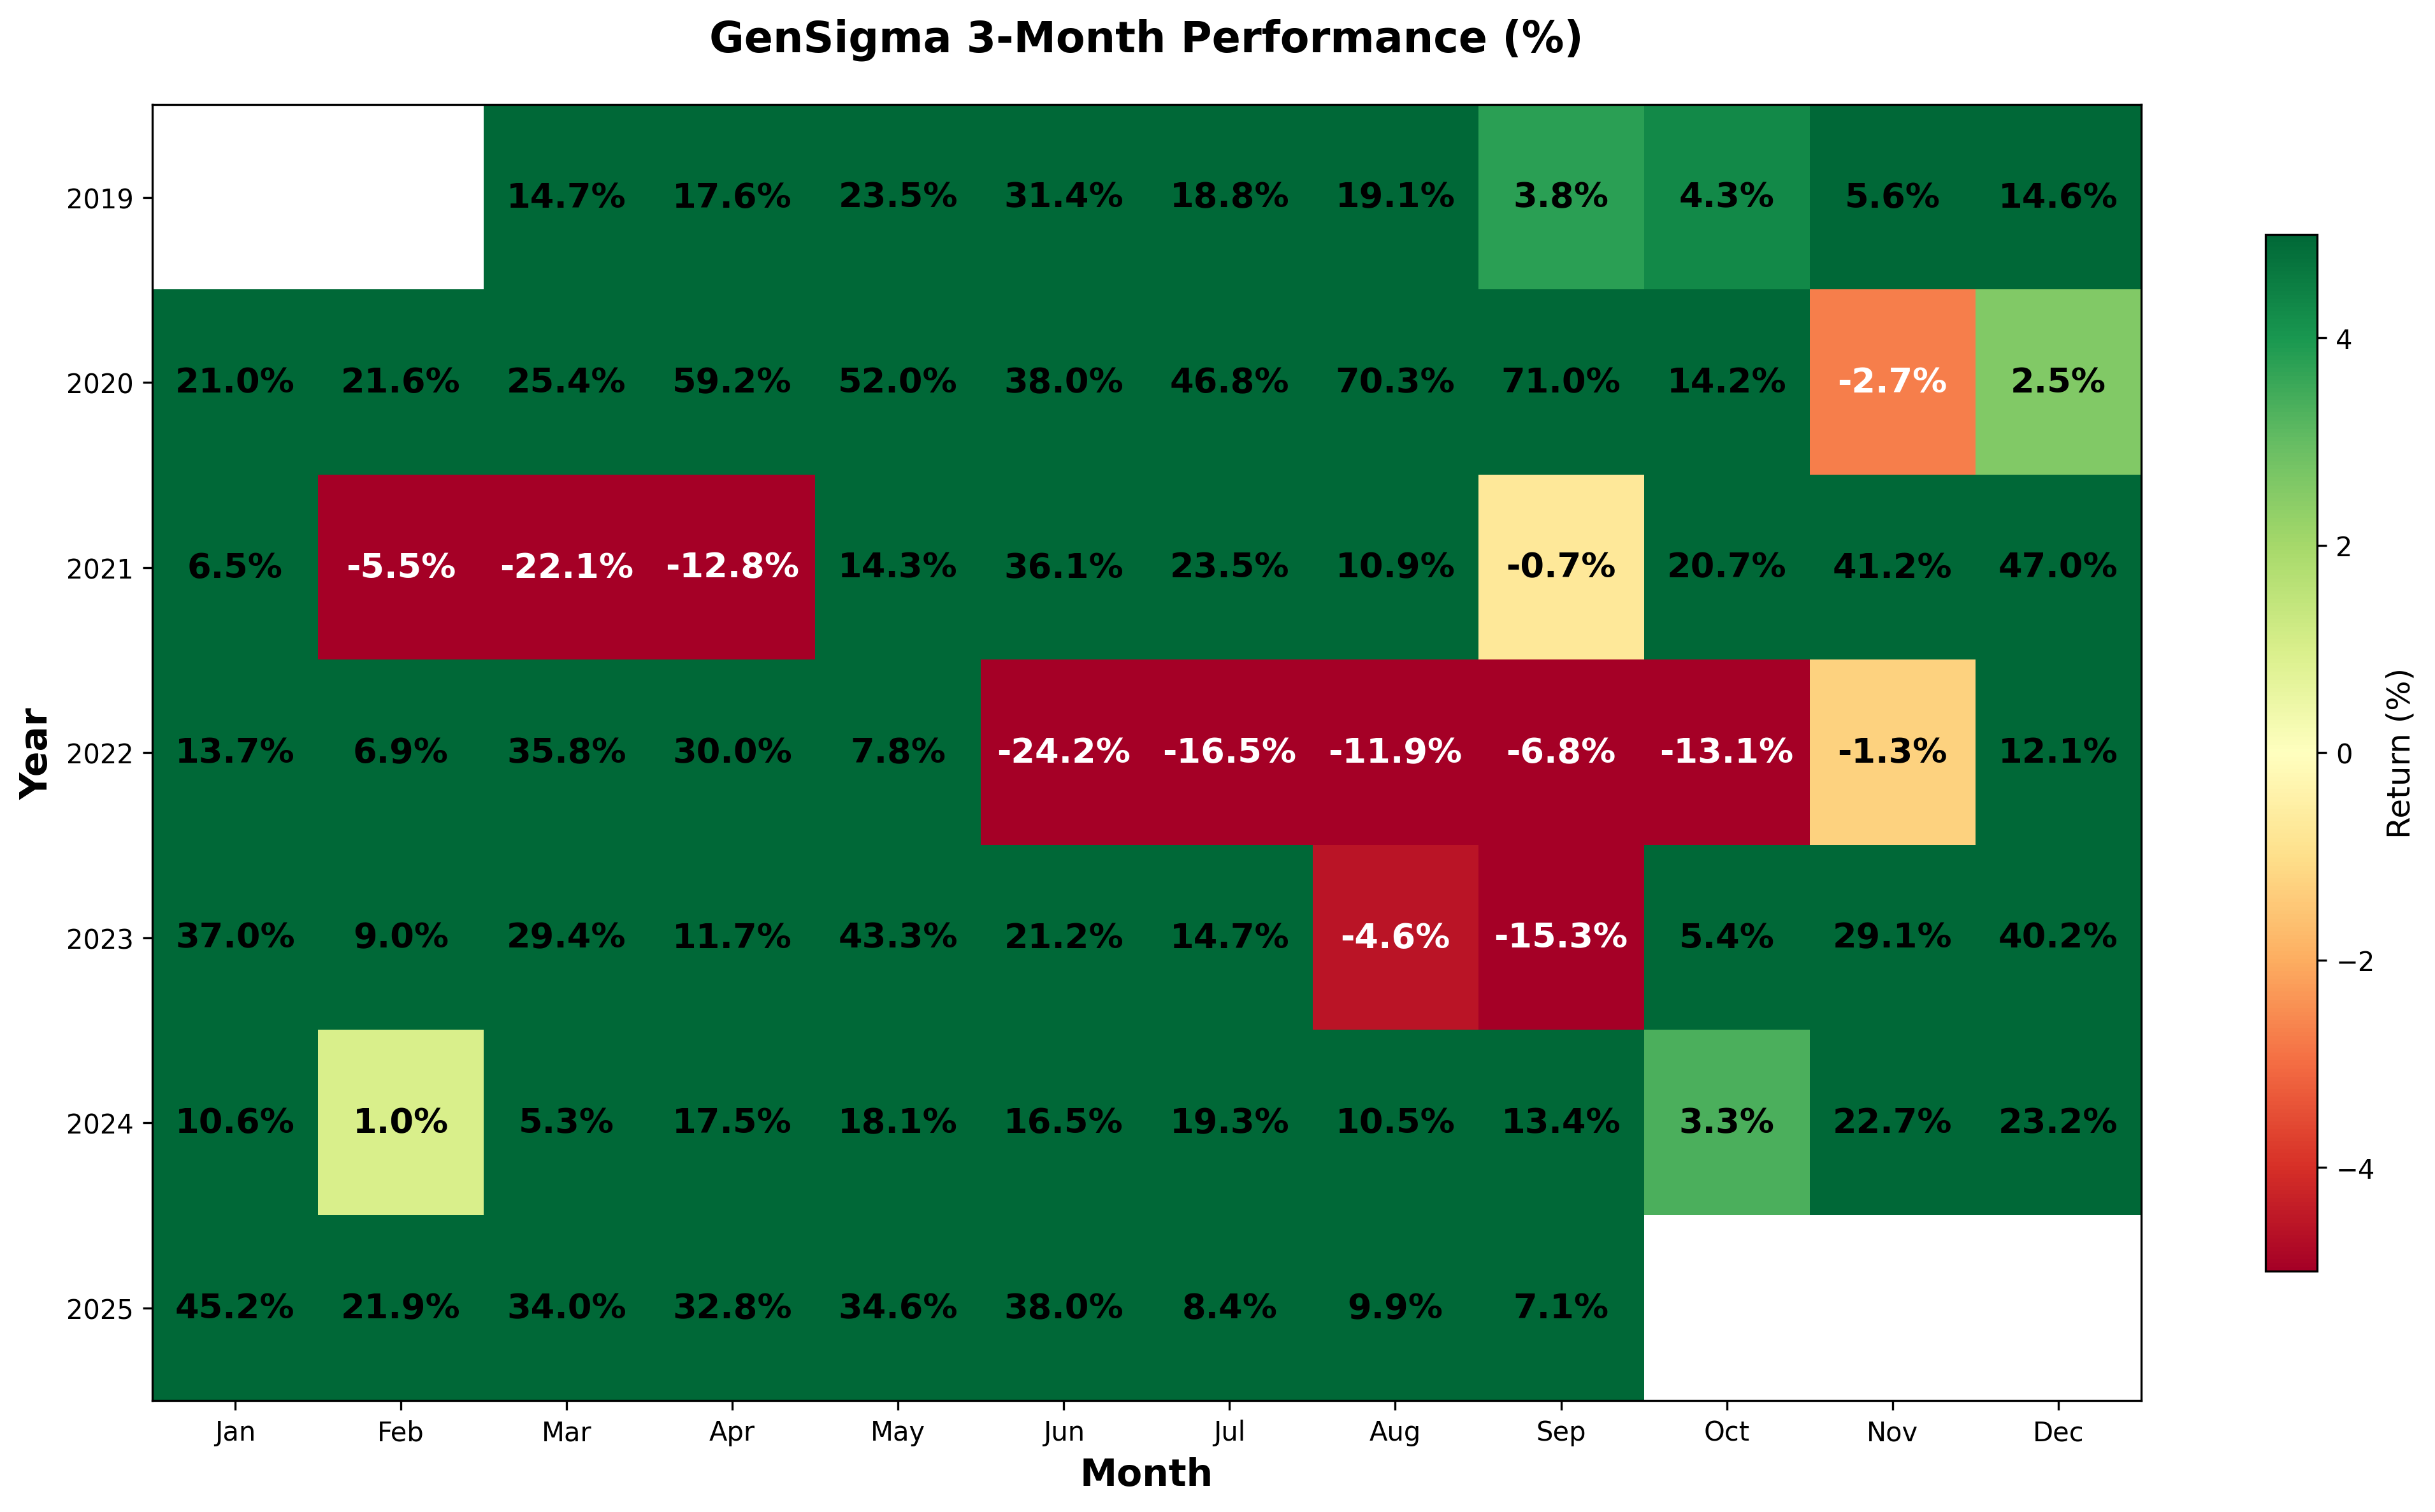
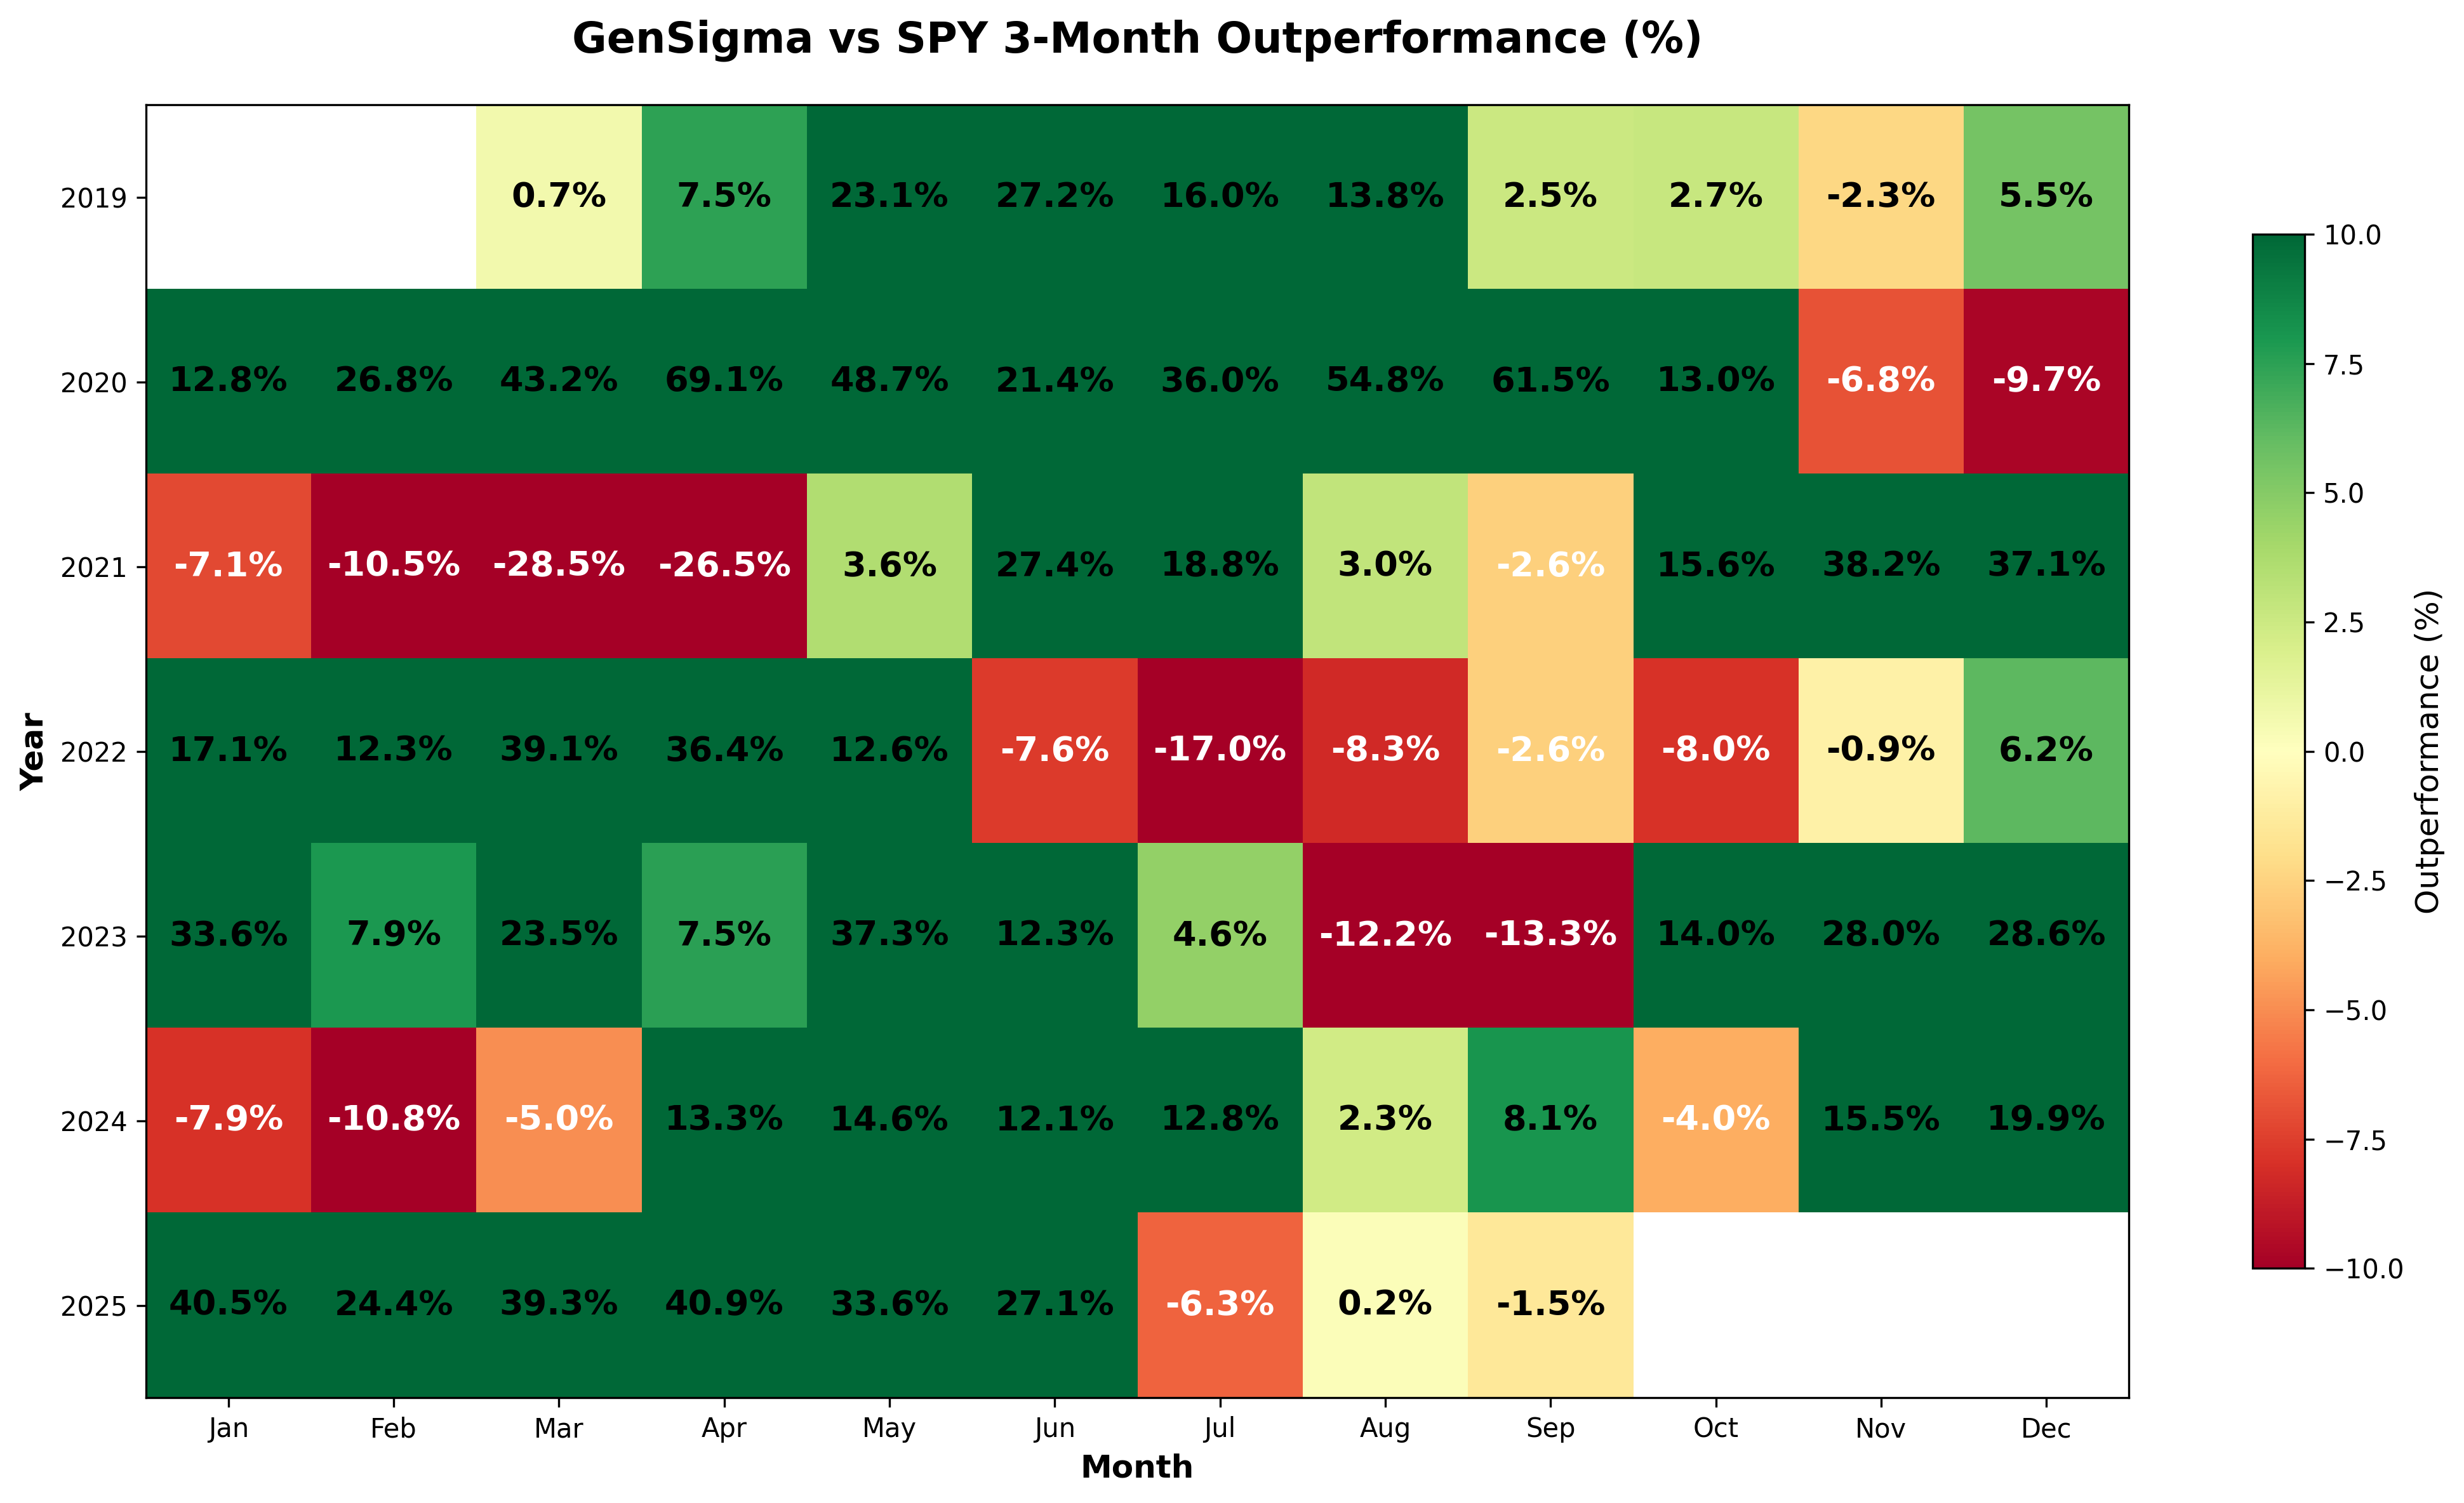
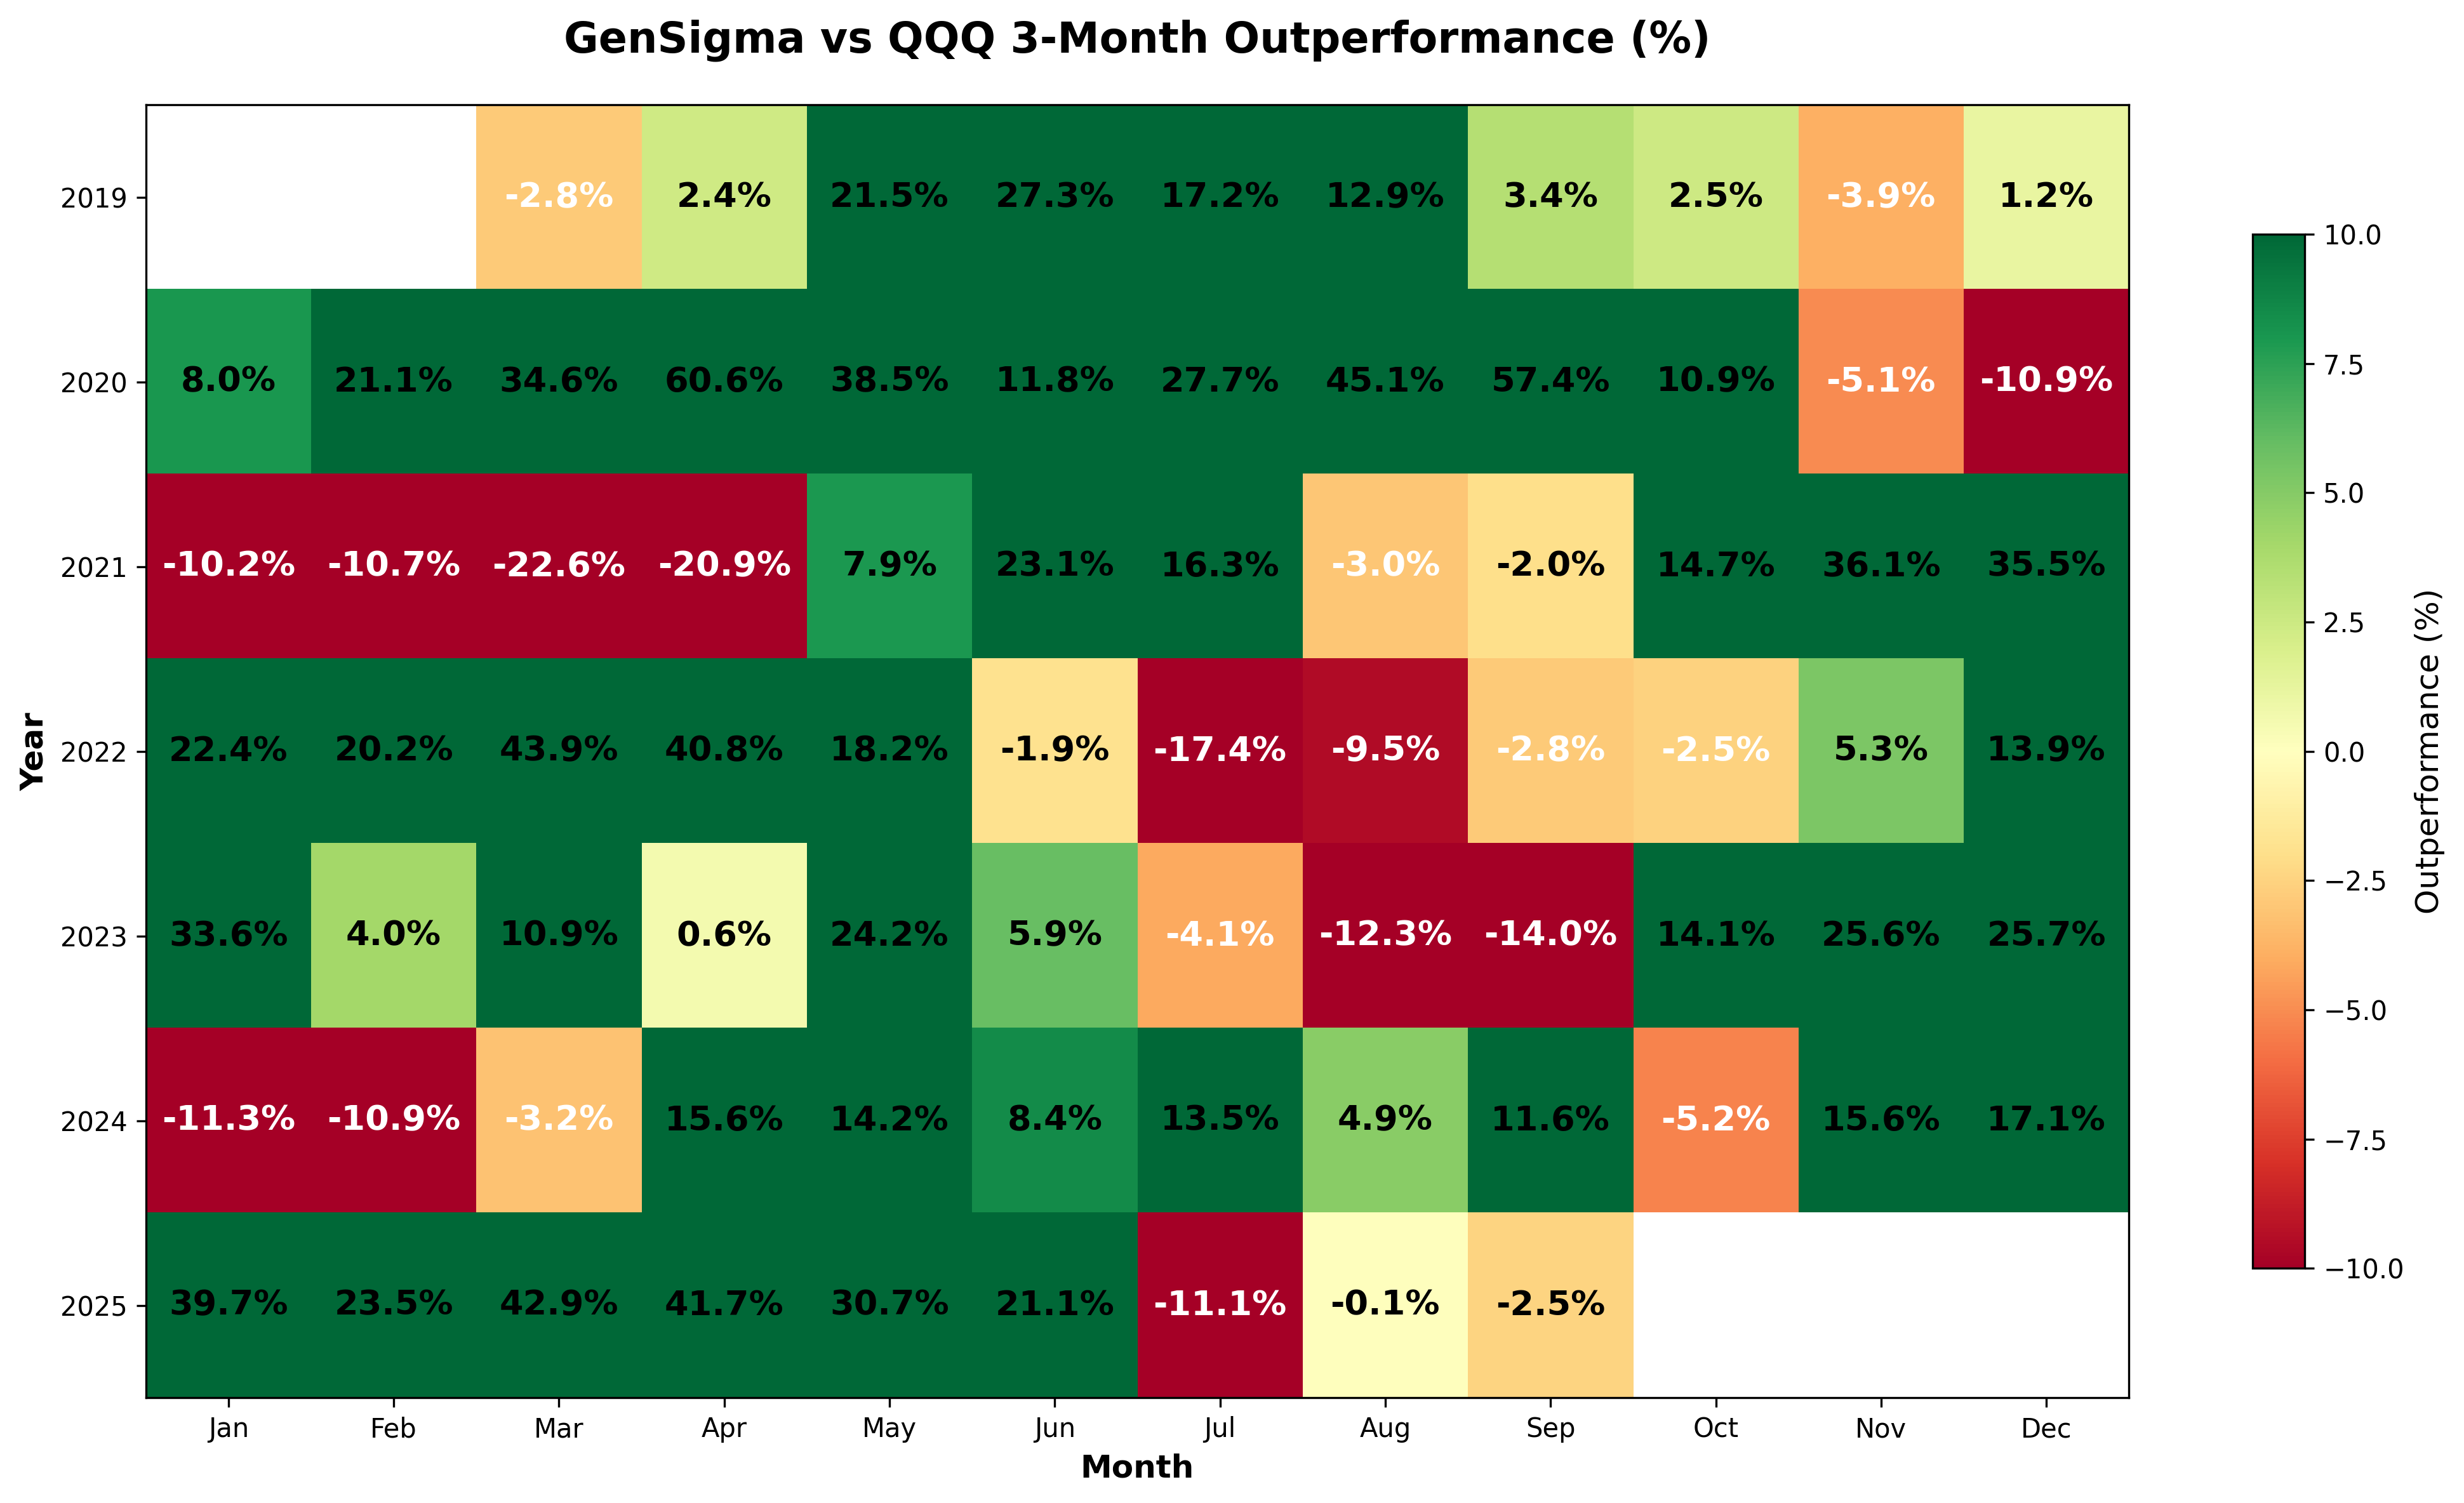
GenSigma - 3-Month Performance Analysis
Click on the individual image to enlarge
How to Read These Charts: The individual portfolio charts show 3-month returns for each strategy. The comparison charts (GenSigma vs Other Portfolio) display the difference in percentage returns between GenSigma and the other portfolio. A positive number indicates GenSigma performed better, while a negative number indicates the other portfolio performed better.
SPY
QQQ
GenSigma
GenSigma vs SPY
GenSigma vs QQQ
*2025 performance is hypothetical YTD as of September 30th, 2025. Past performance does not guarantee future results.
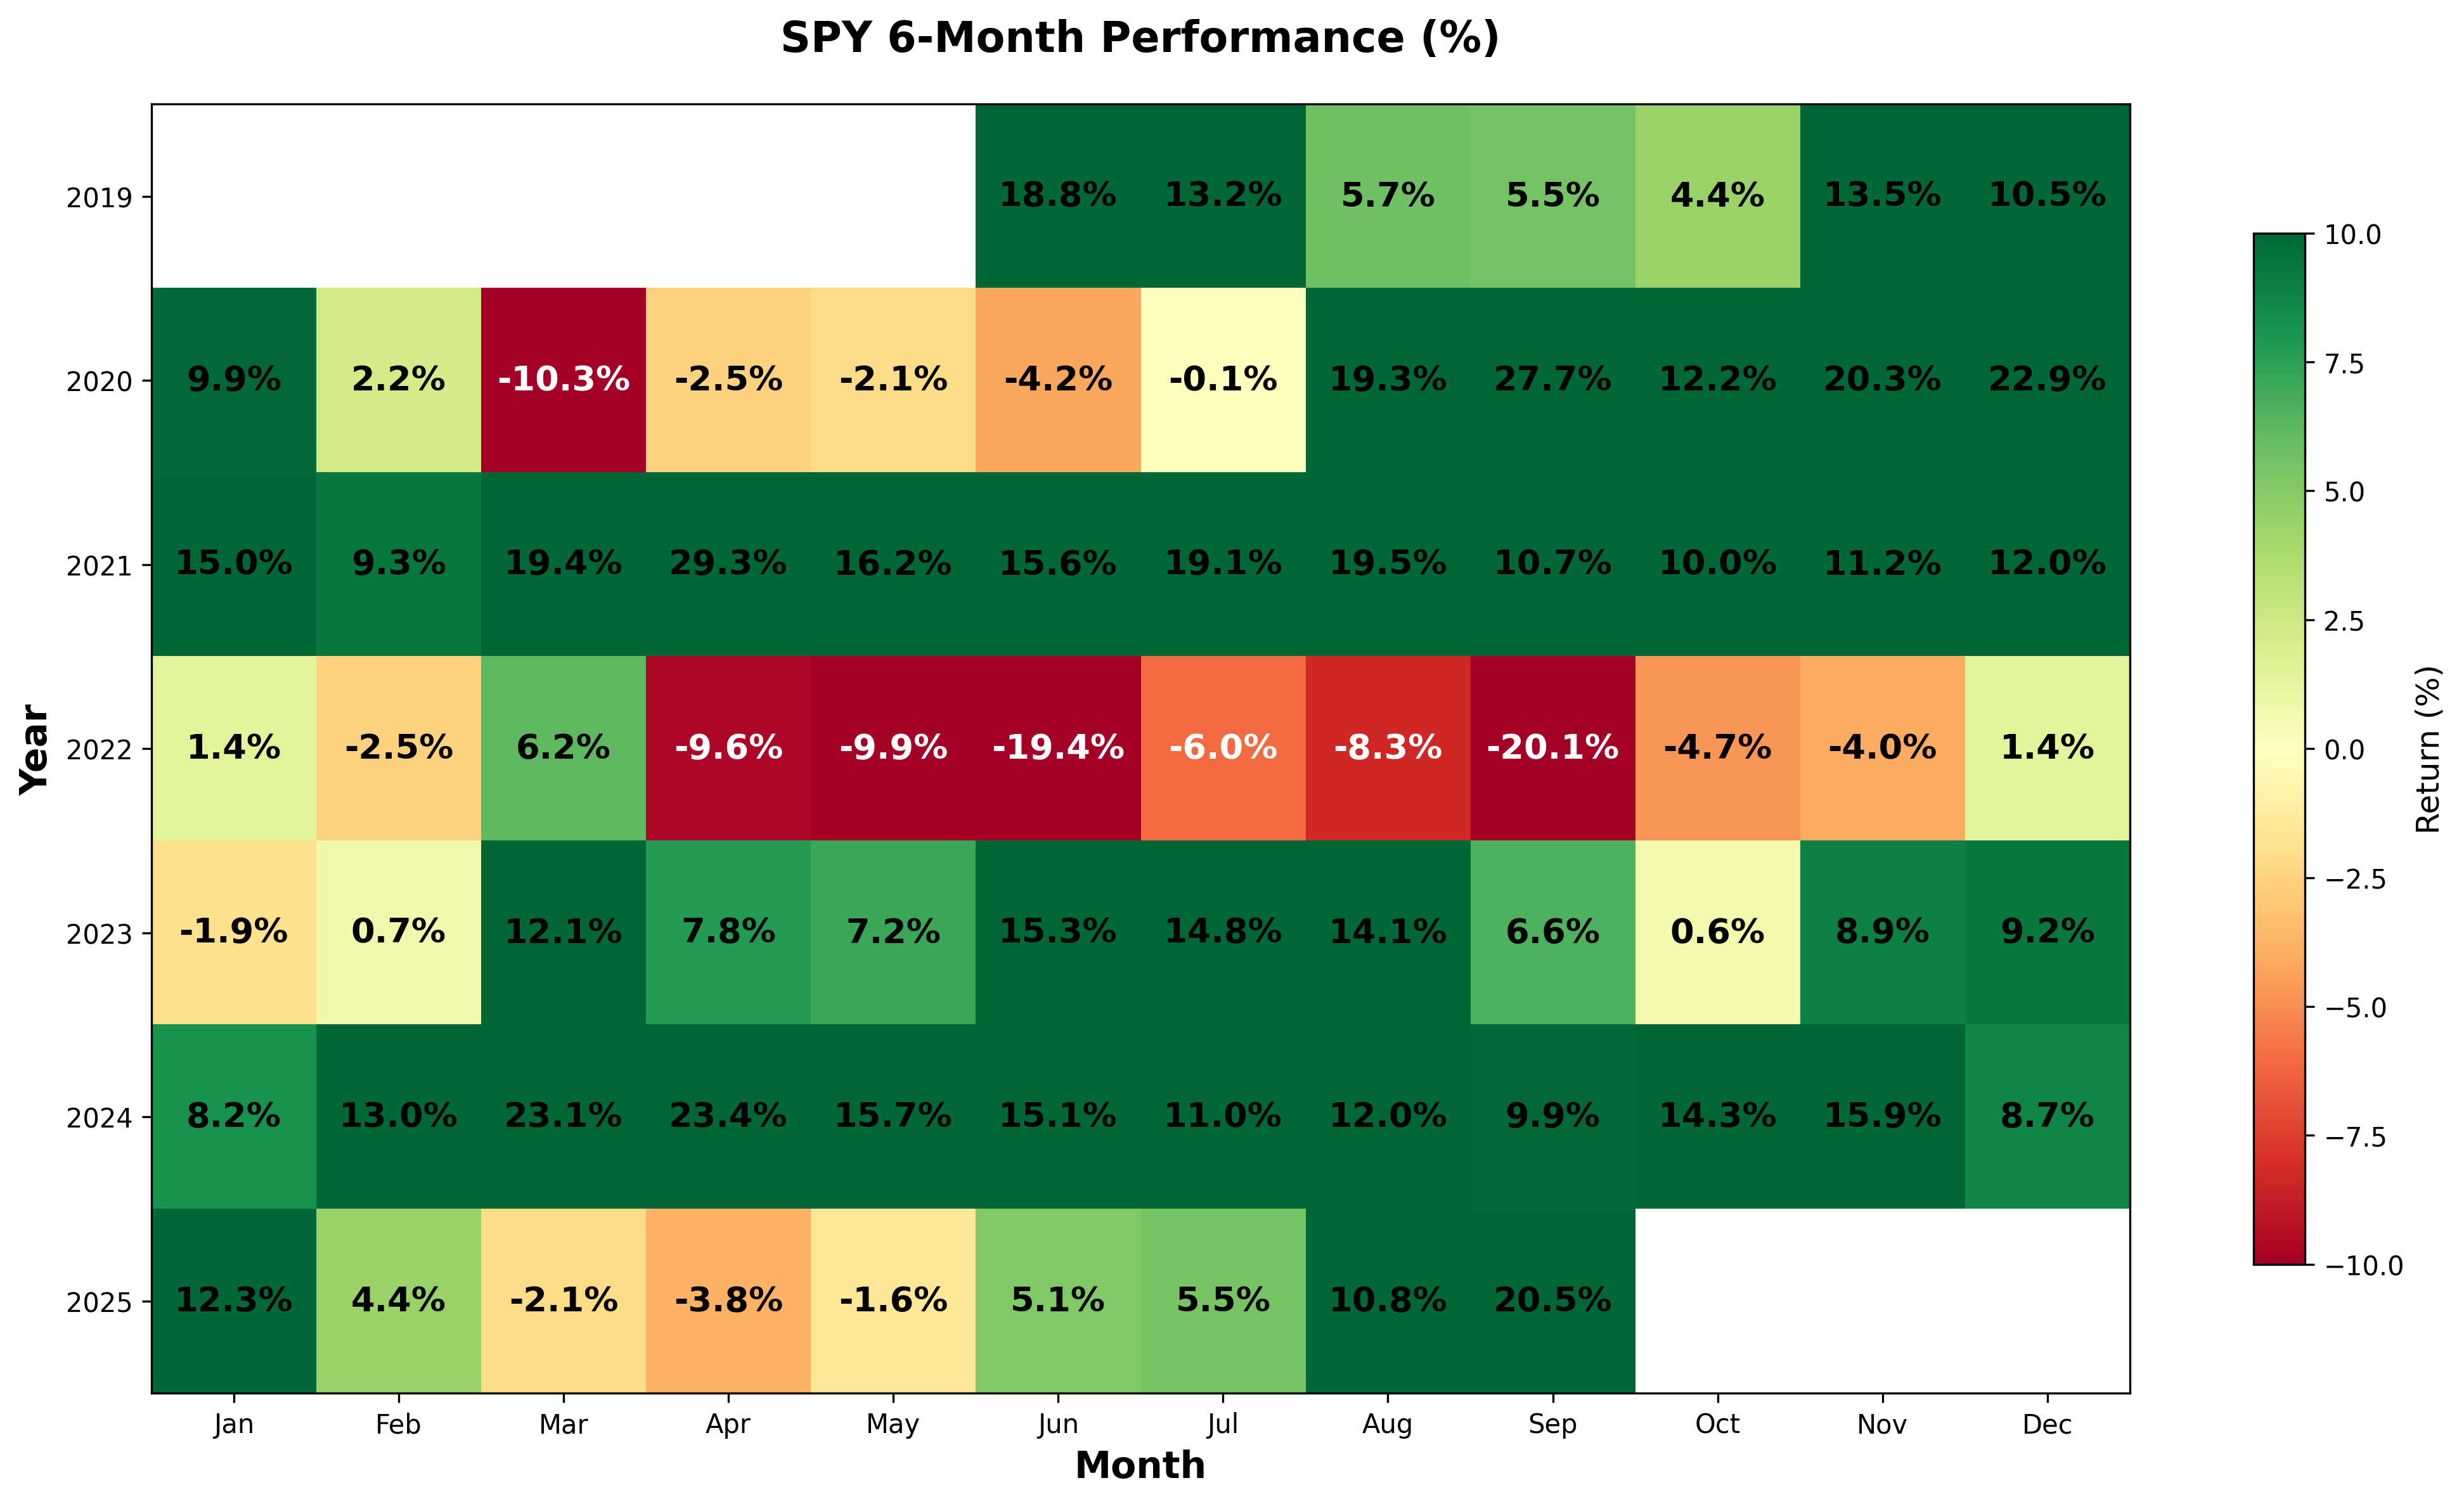
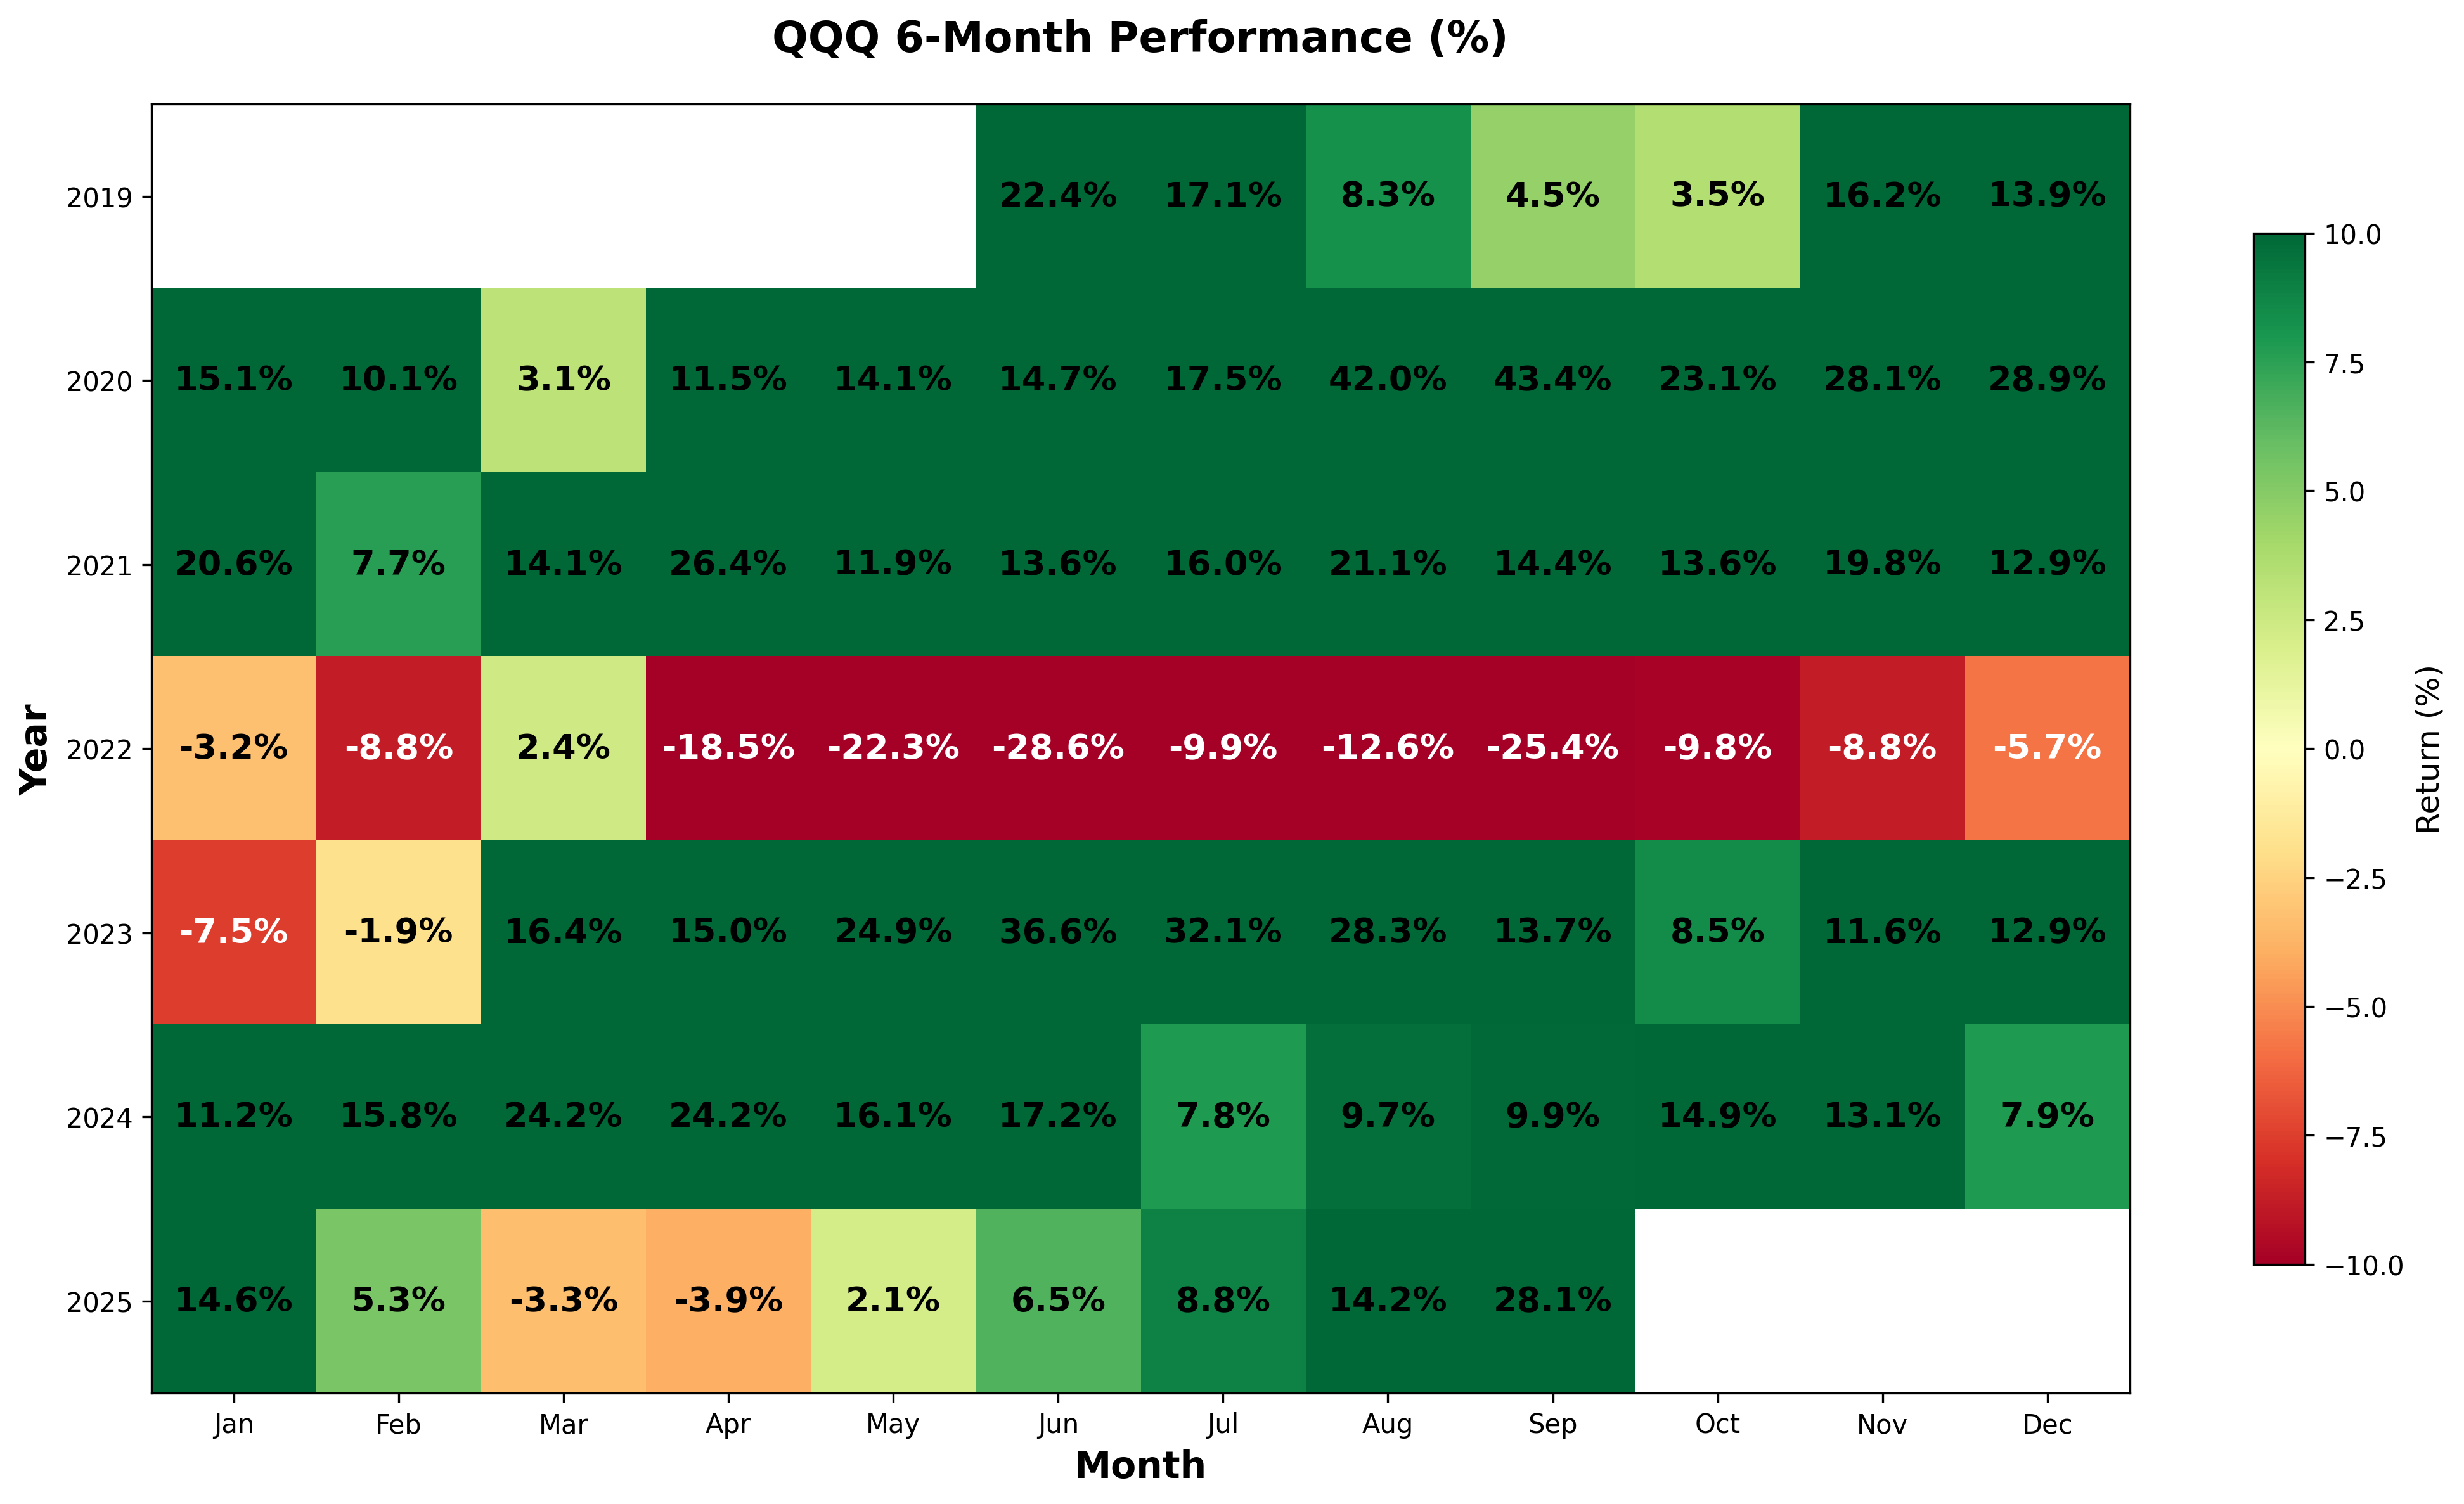
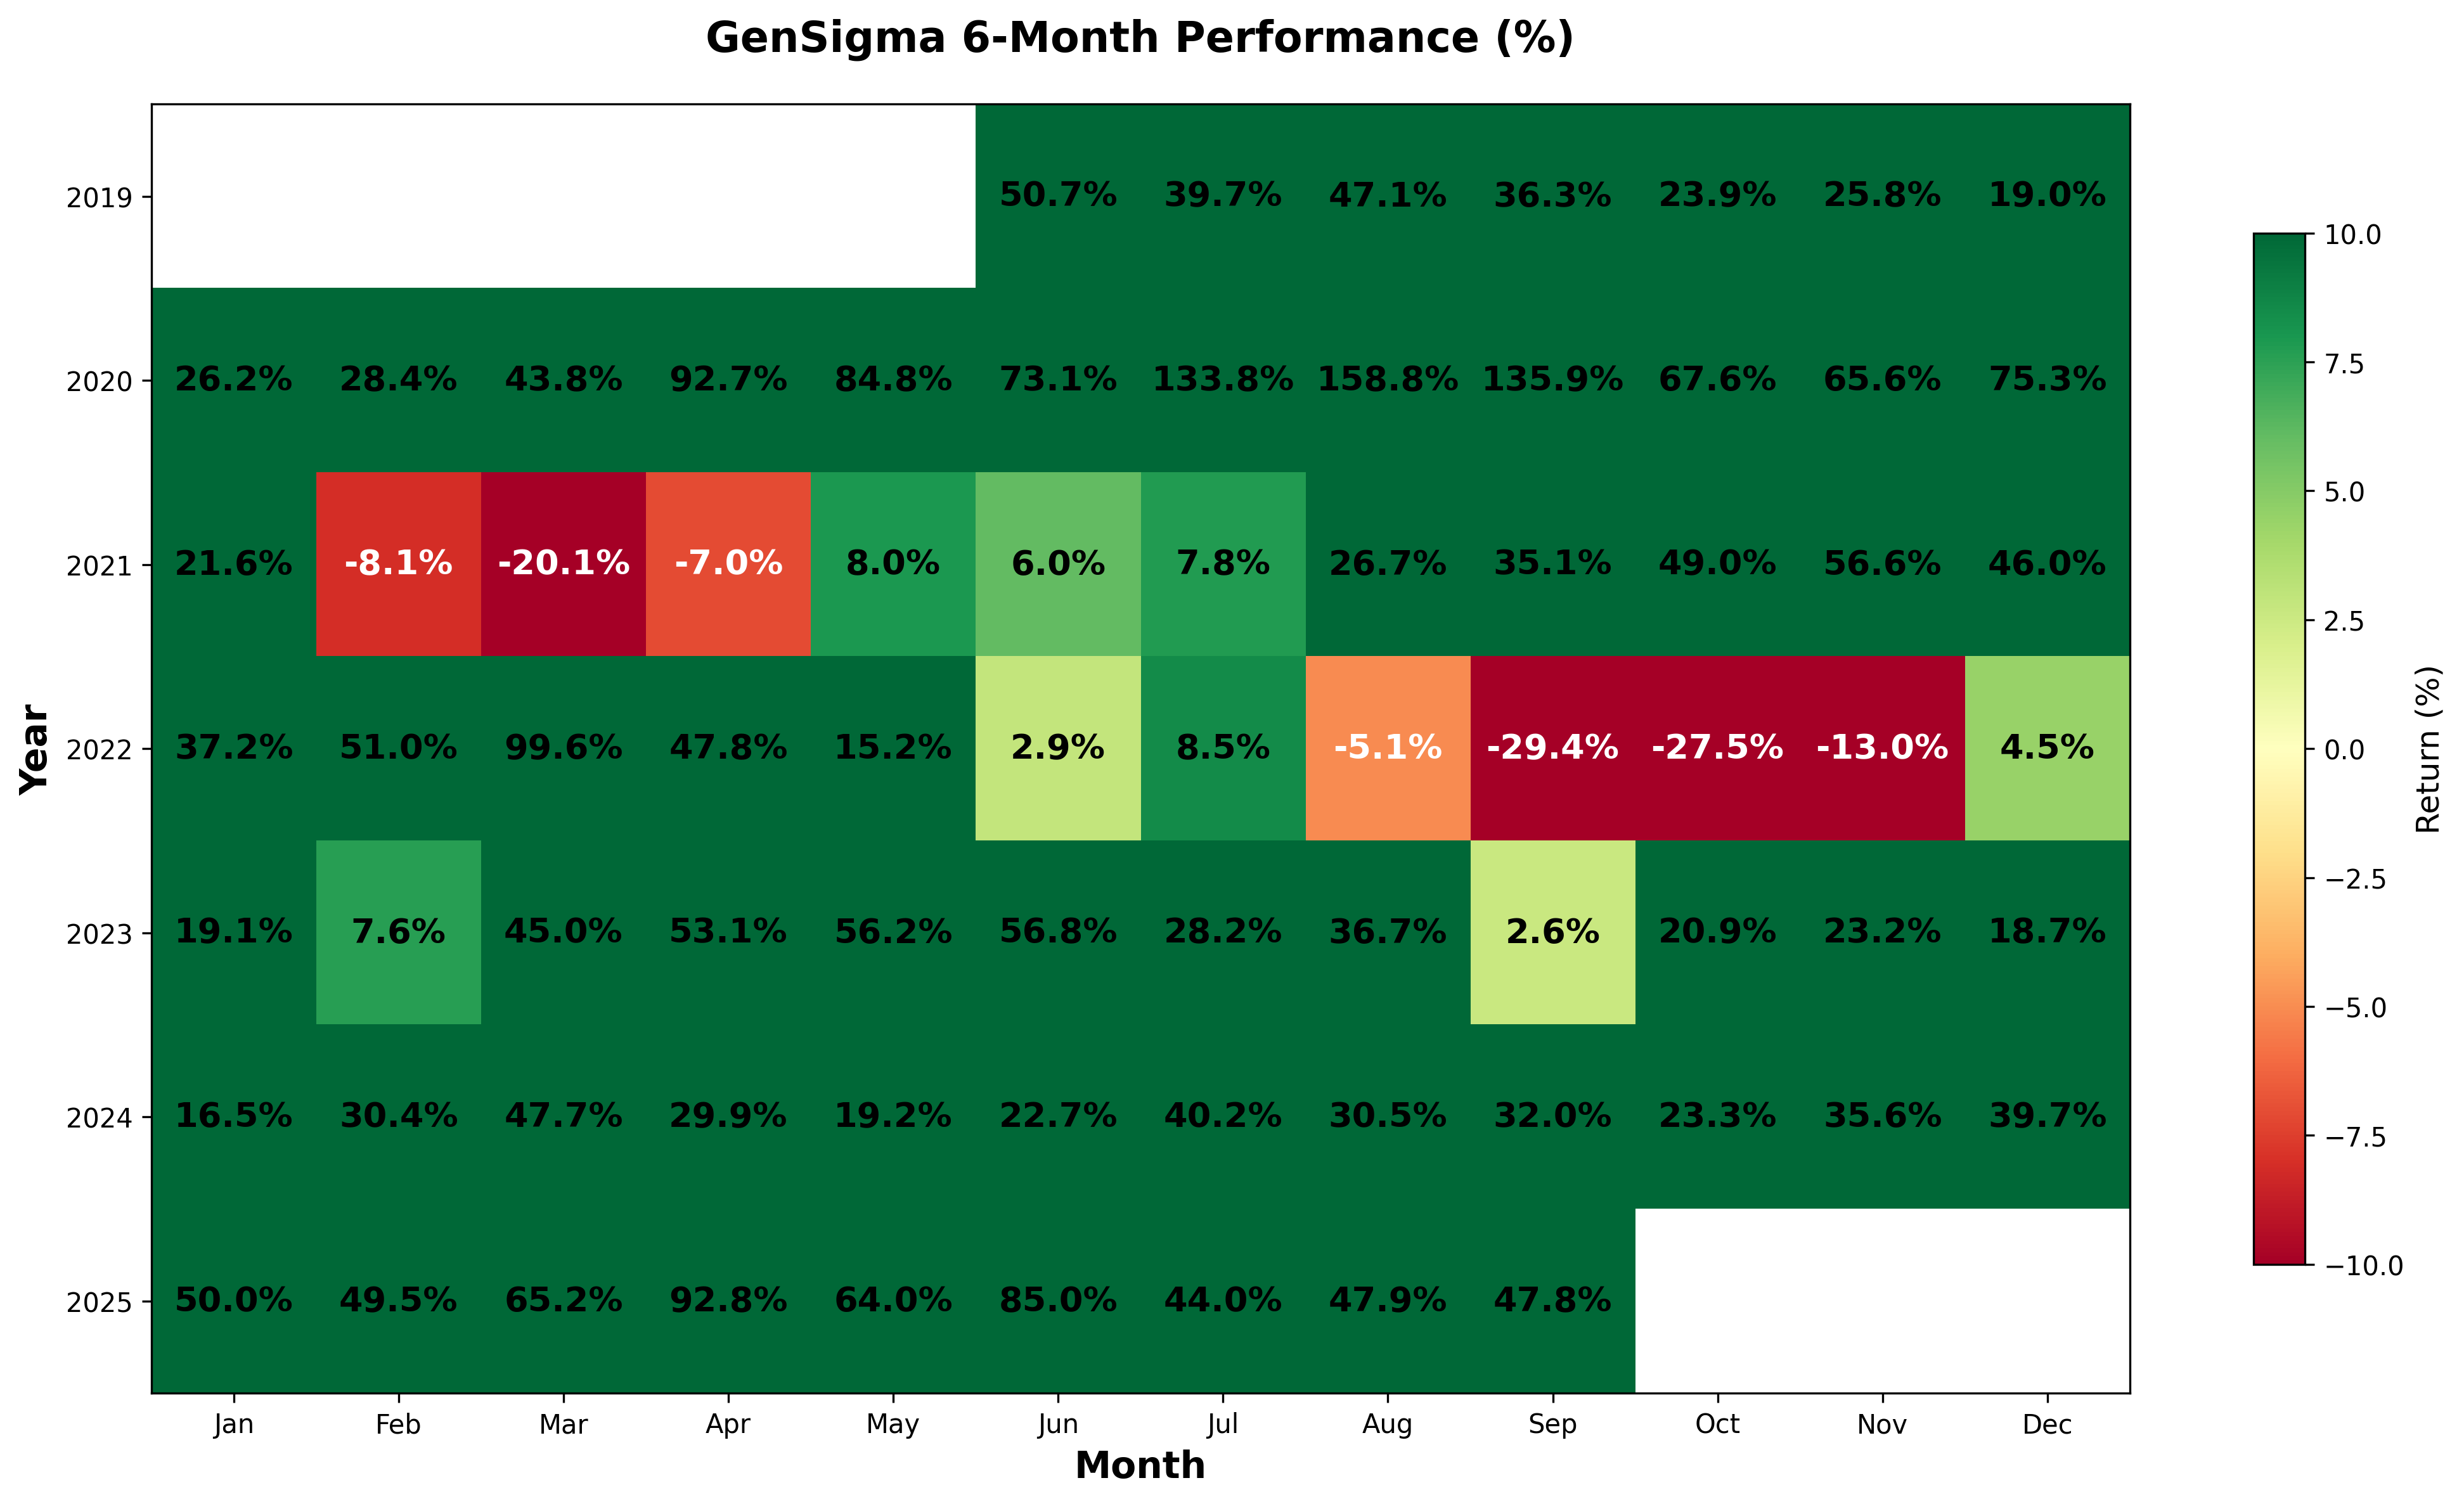
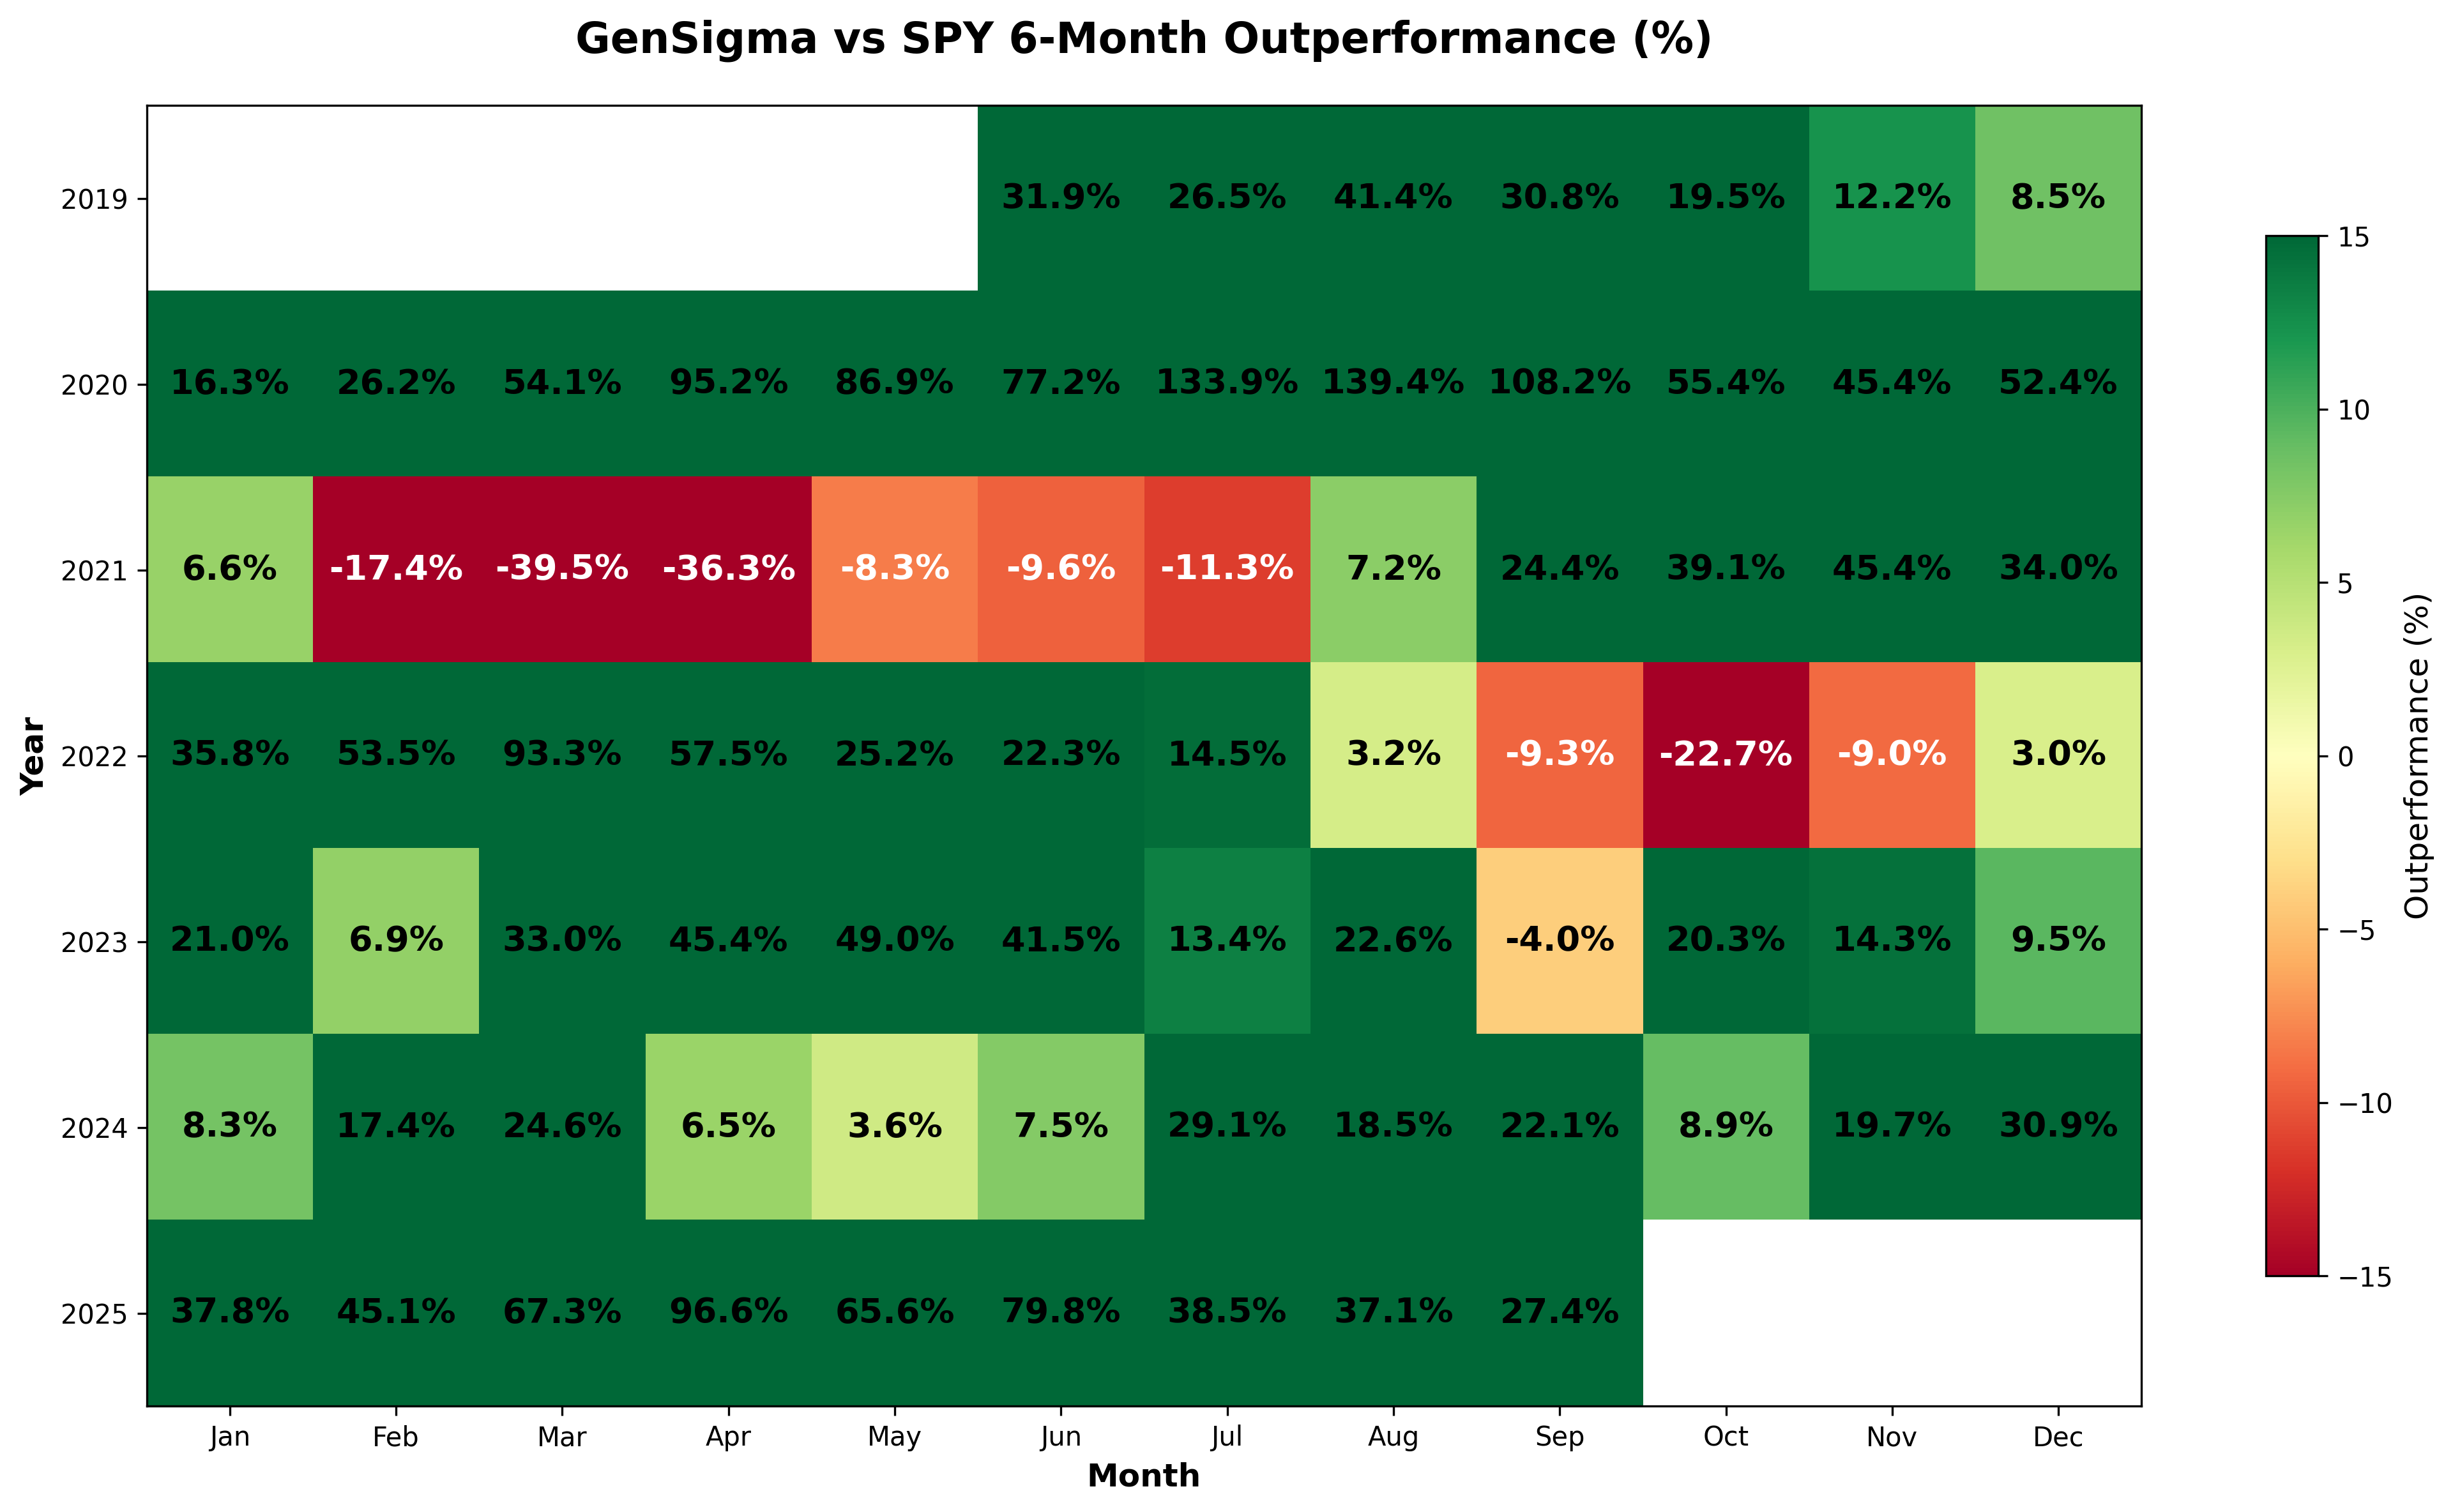
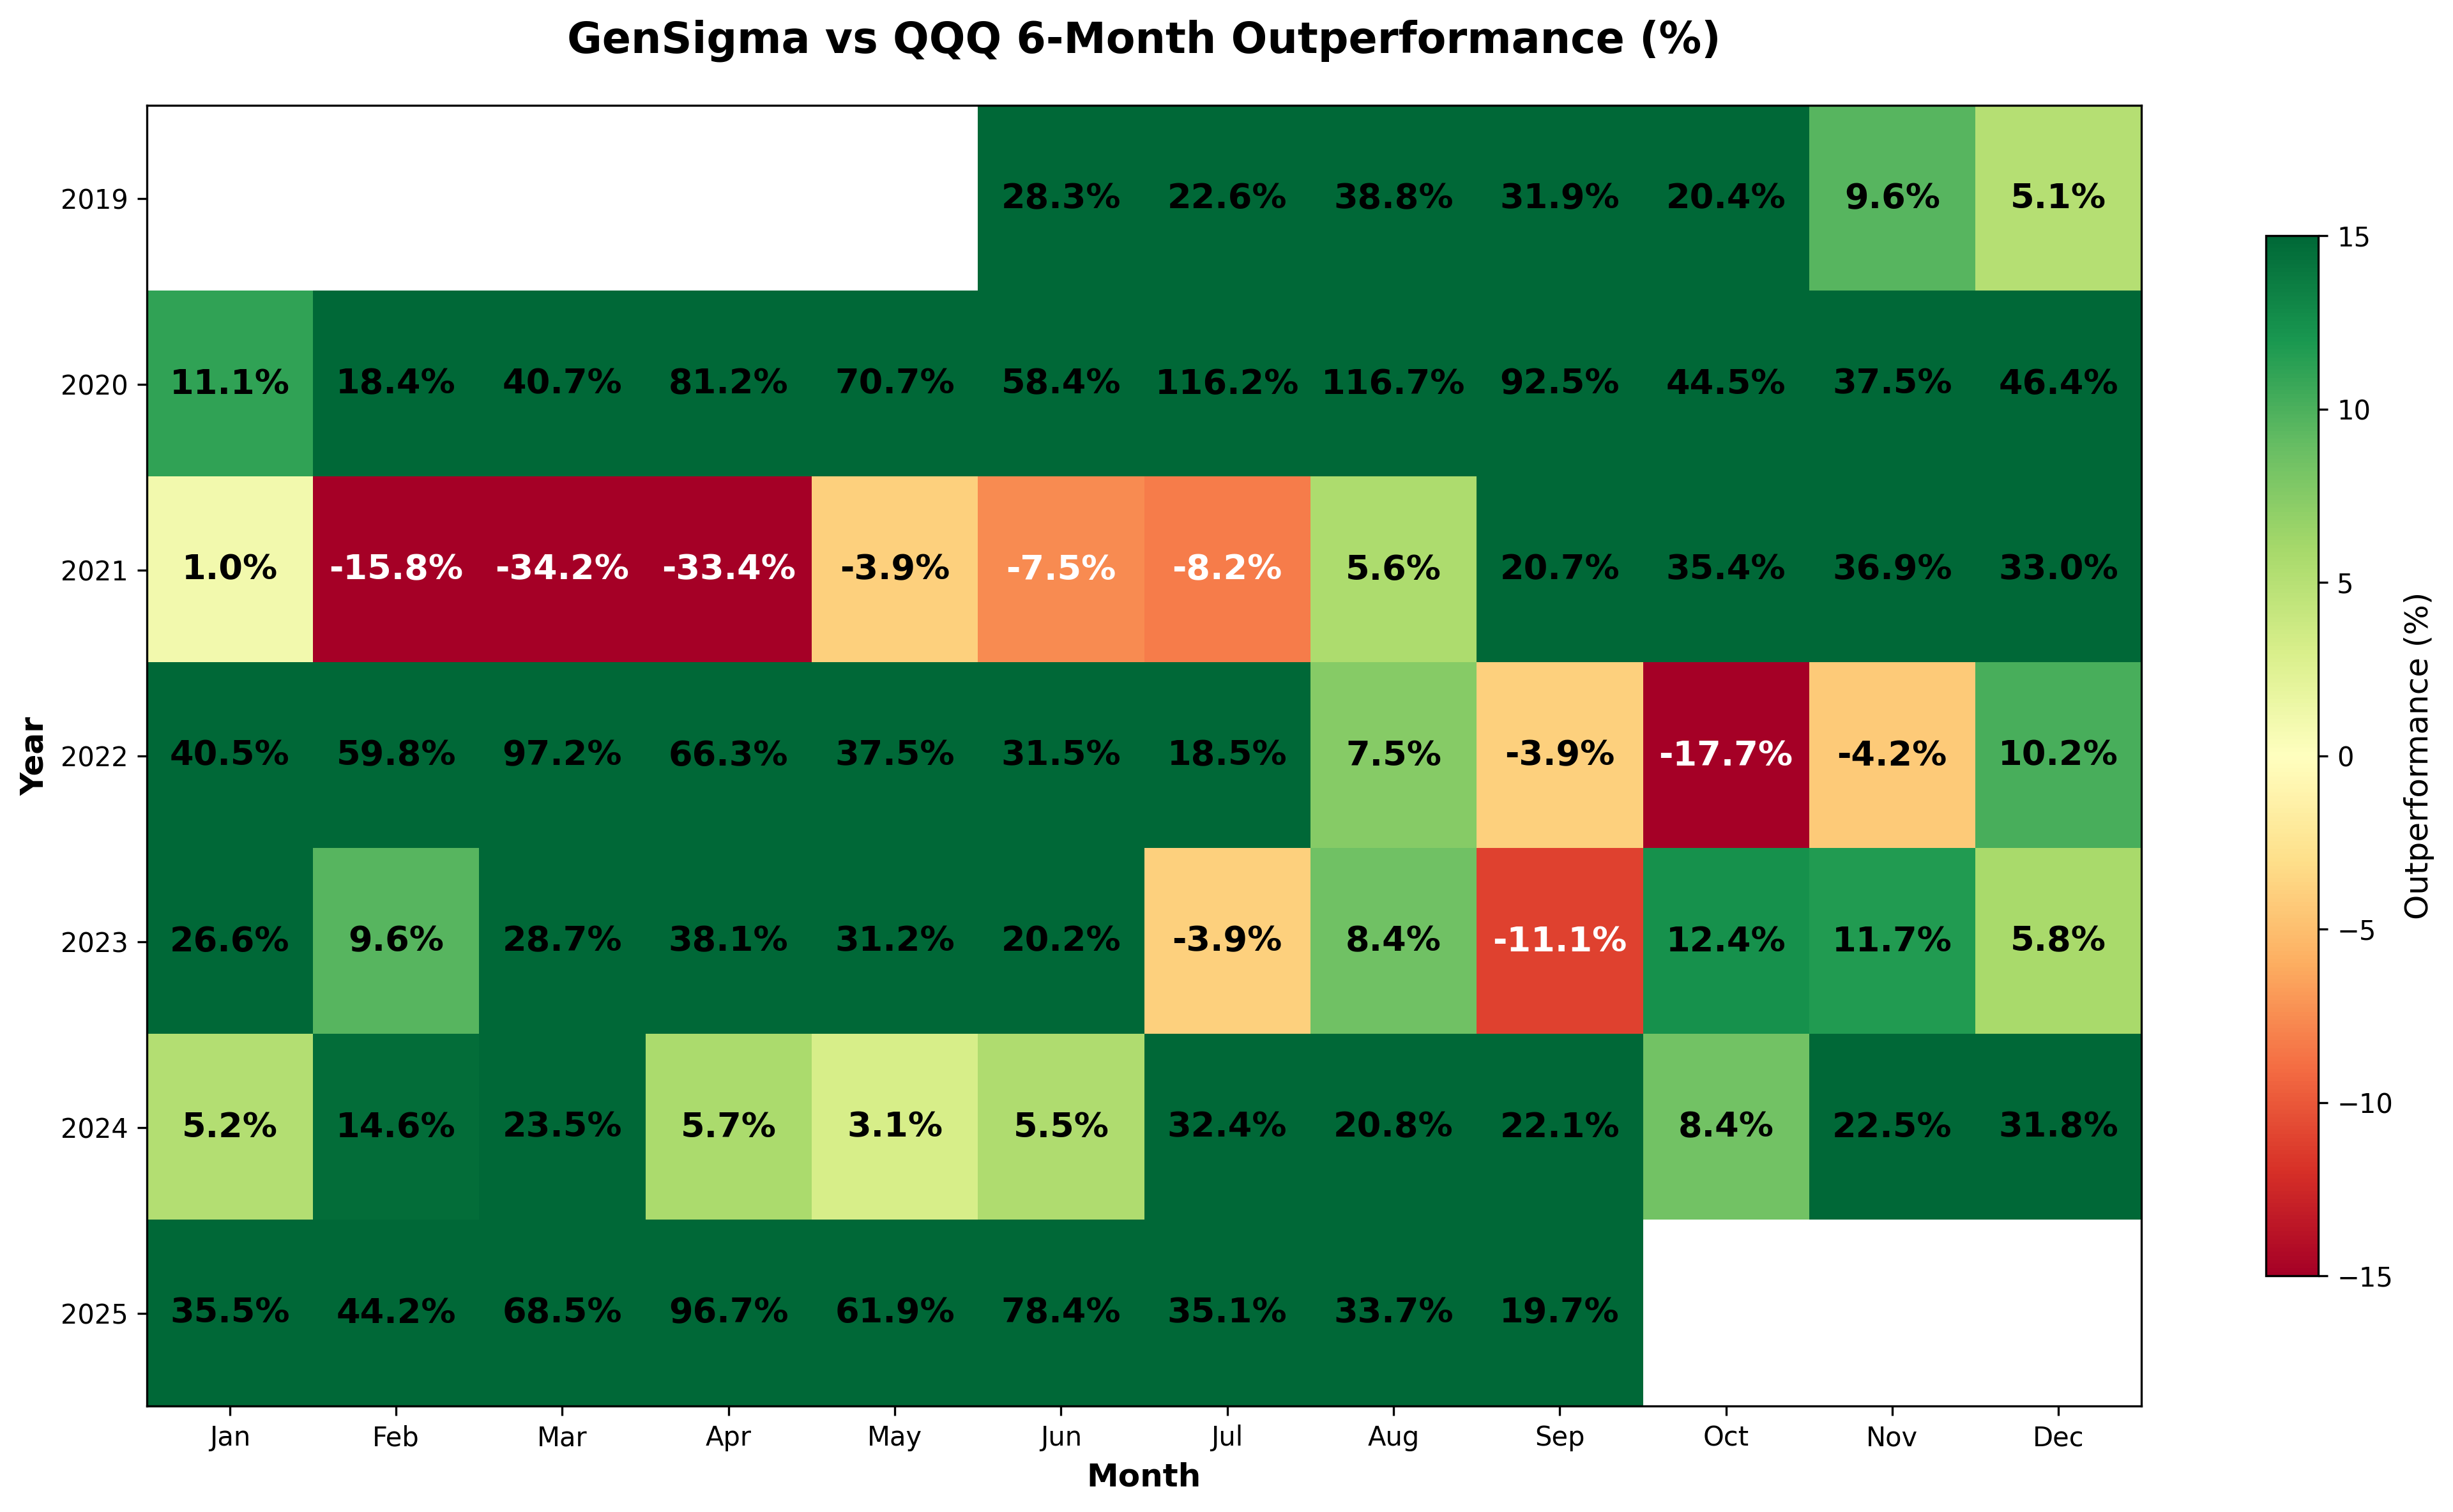
GenSigma - 6-Month Performance Analysis
Click on the individual image to enlarge
How to Read These Charts: The individual portfolio charts show 6-month returns for each strategy. The comparison charts (GenSigma vs Other Portfolio) display the difference in percentage returns between GenSigma and the other portfolio. A positive number indicates GenSigma performed better, while a negative number indicates the other portfolio performed better.
SPY
QQQ
GenSigma
GenSigma vs SPY
GenSigma vs QQQ
*2025 performance is hypothetical YTD as of September 30th, 2025. Past performance does not guarantee future results.
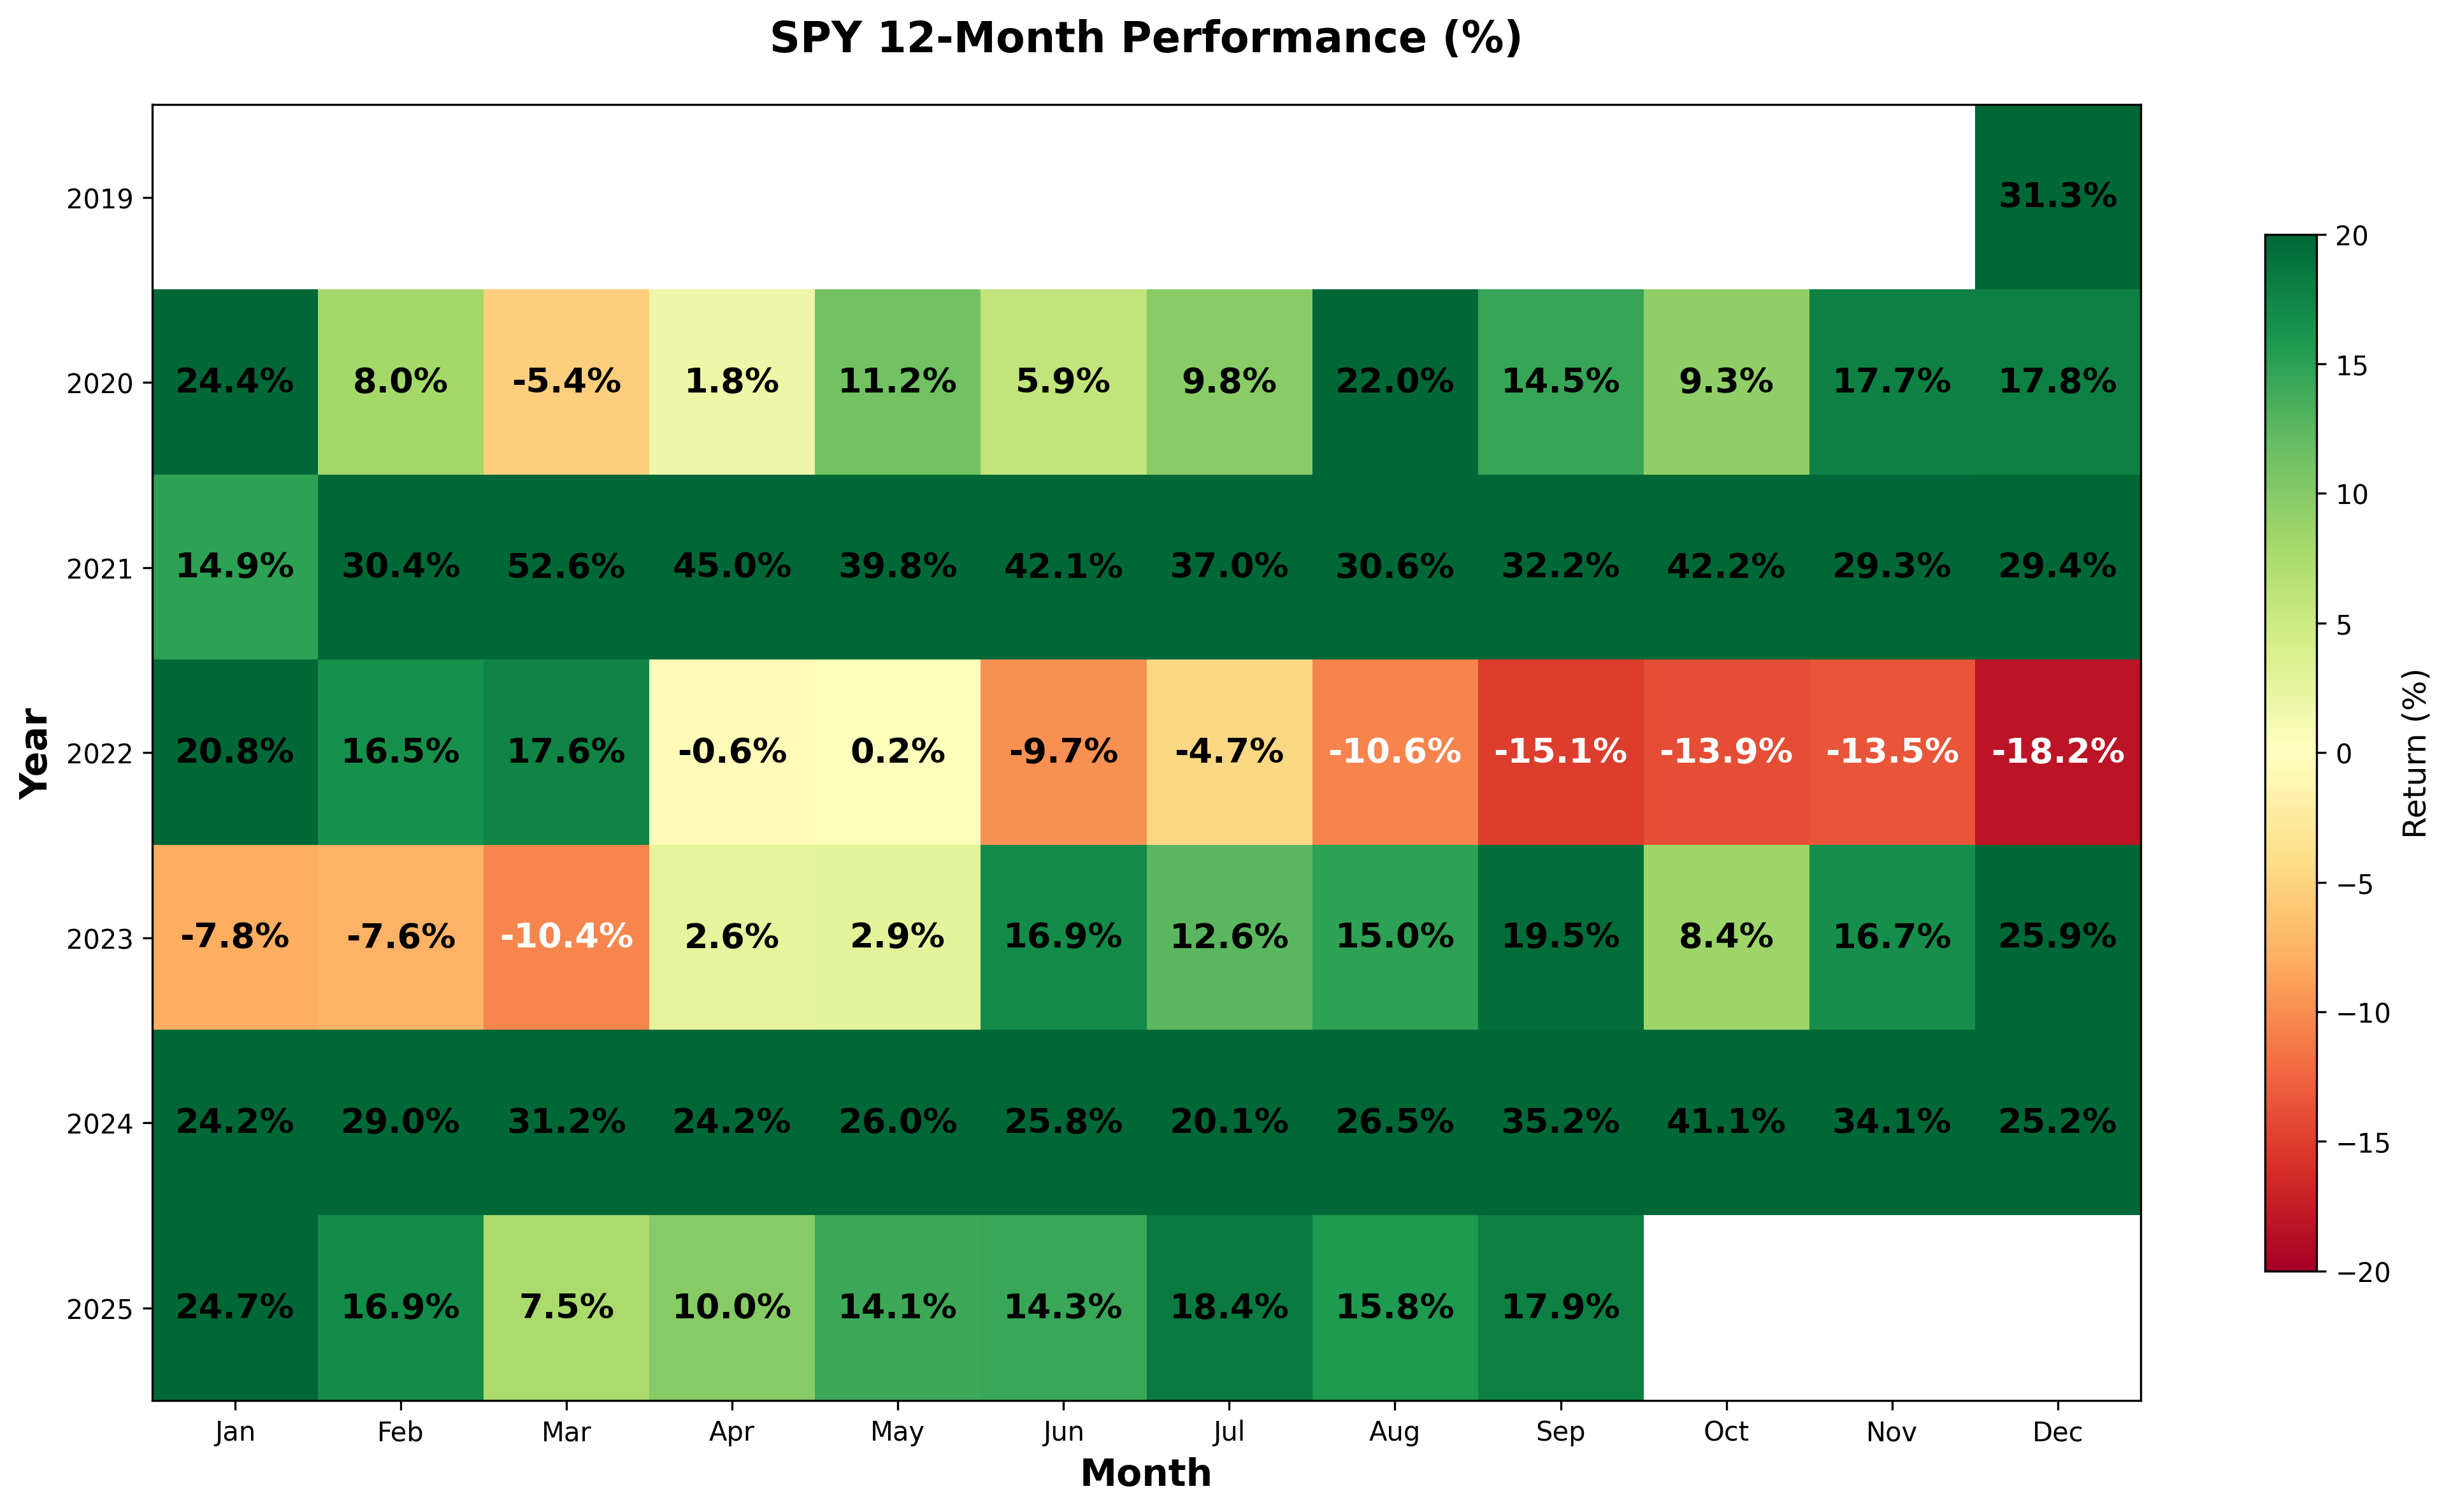
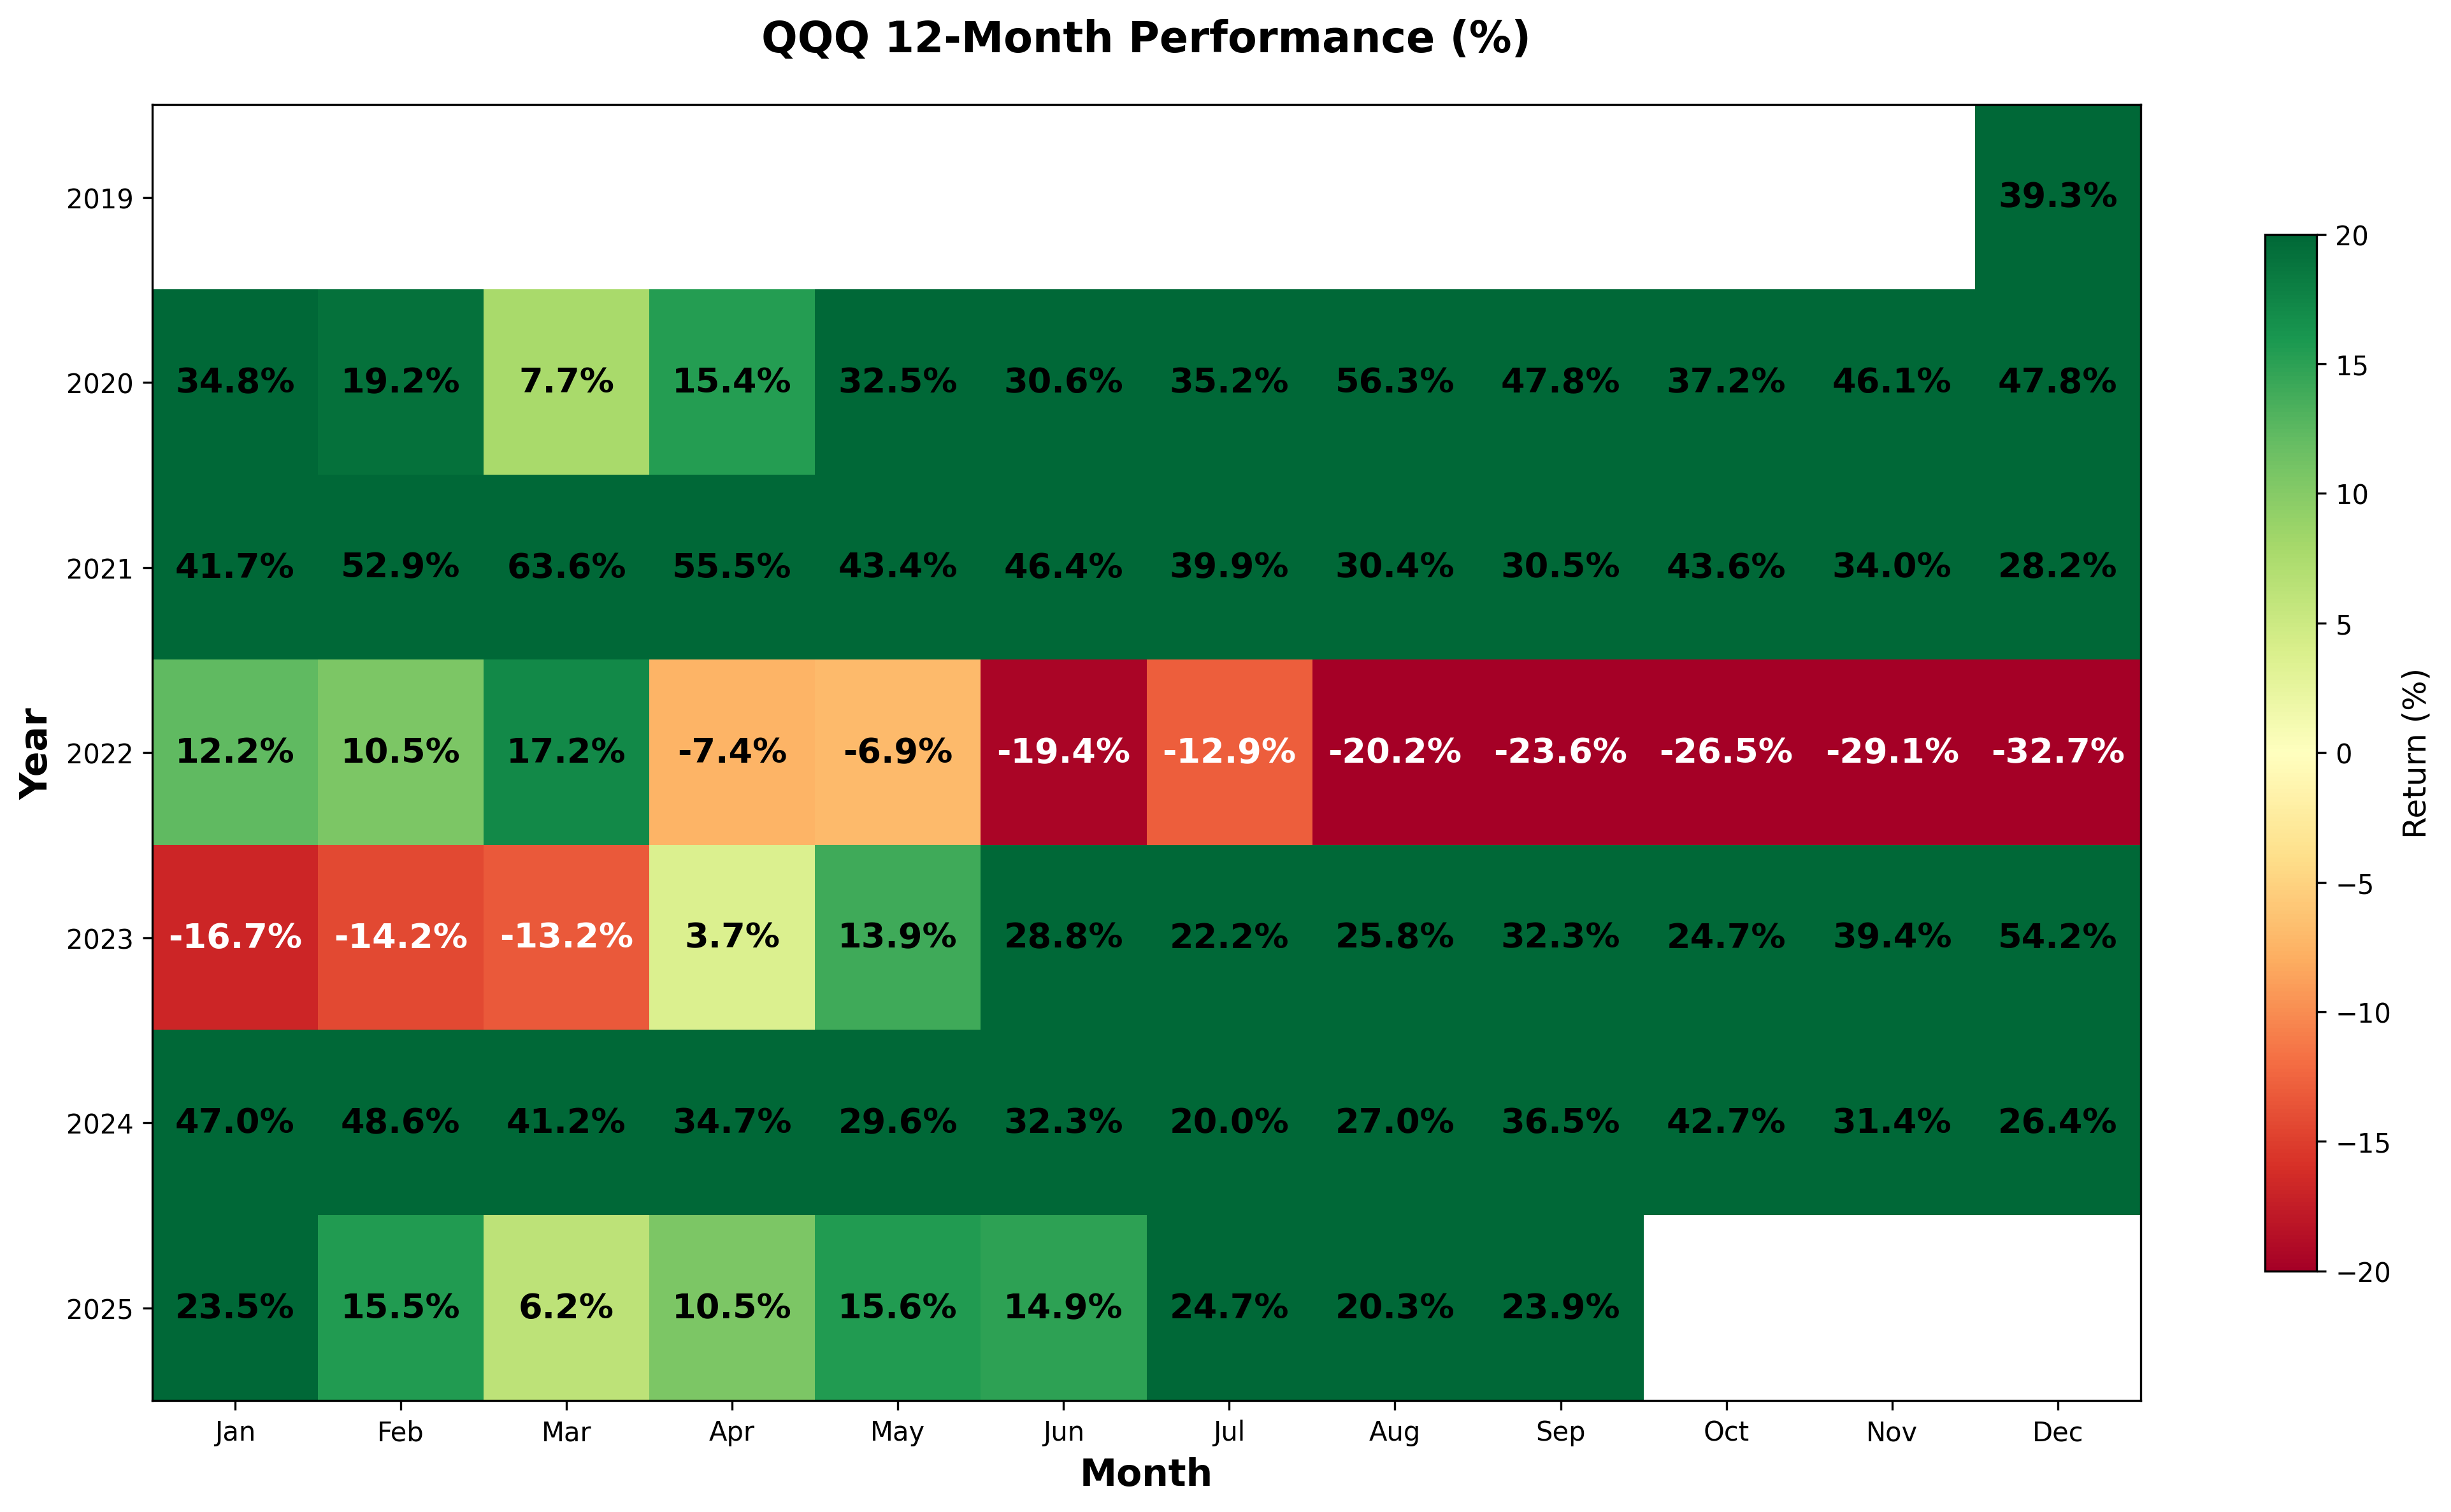
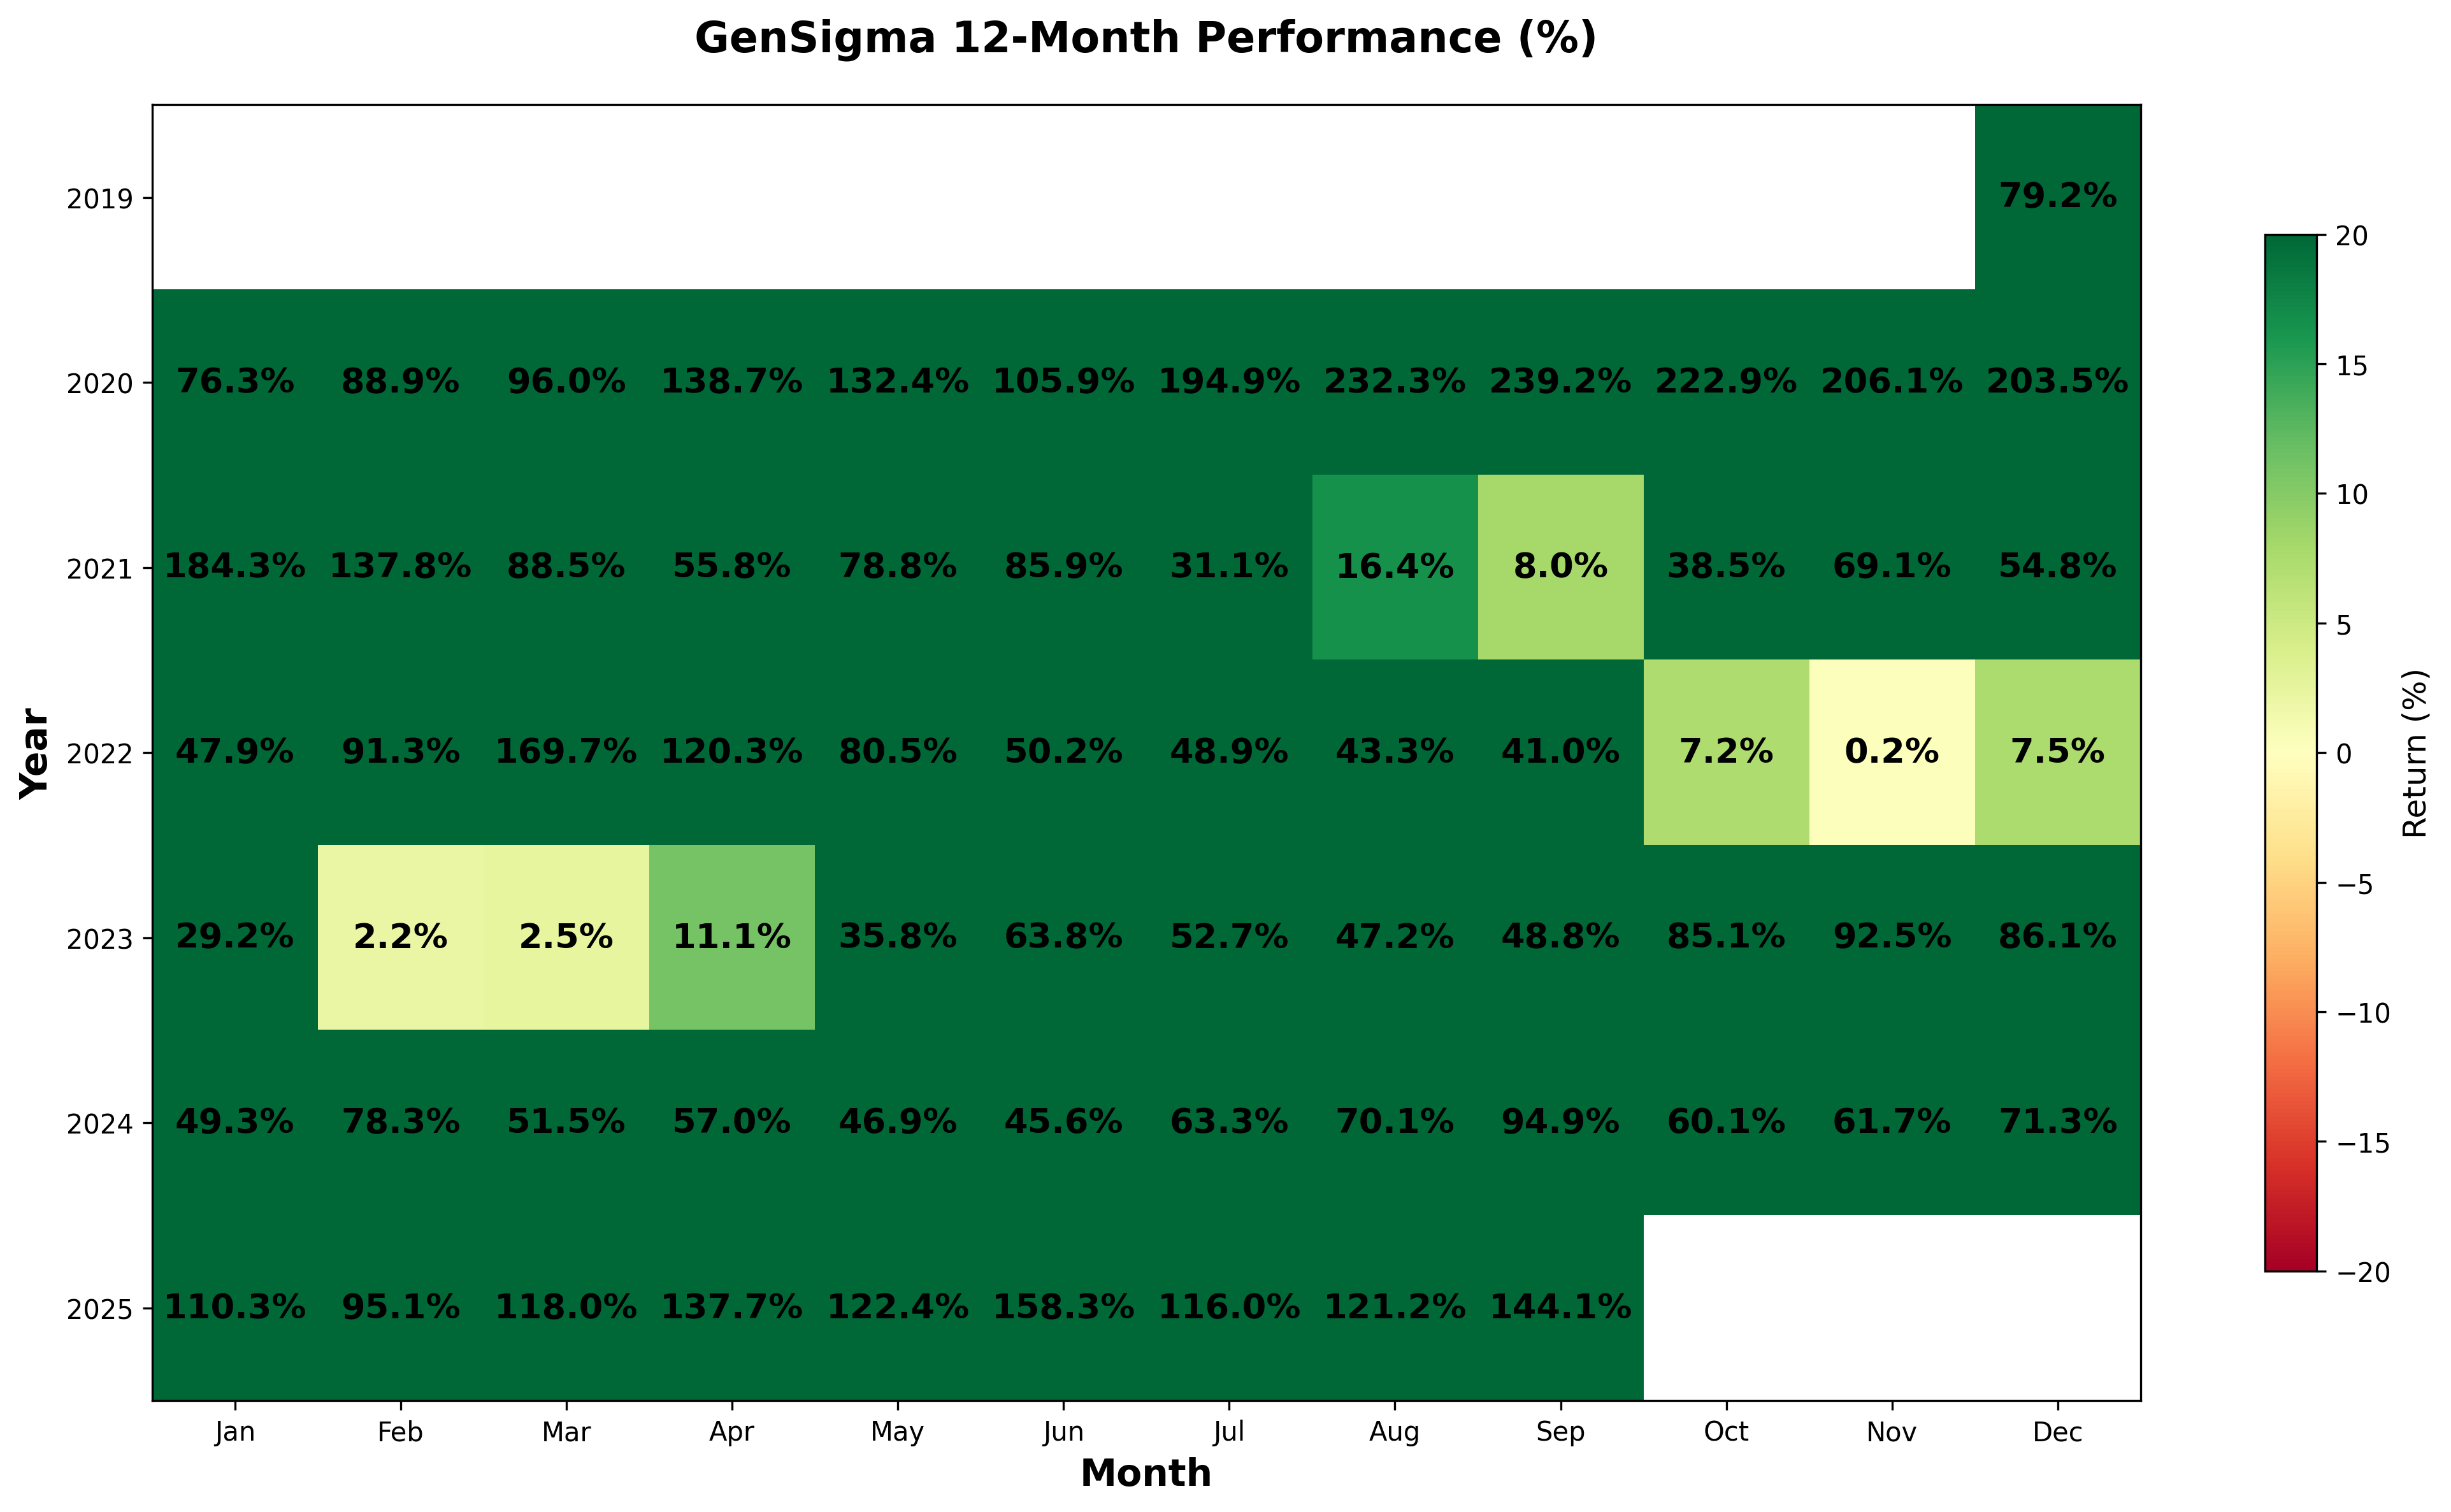
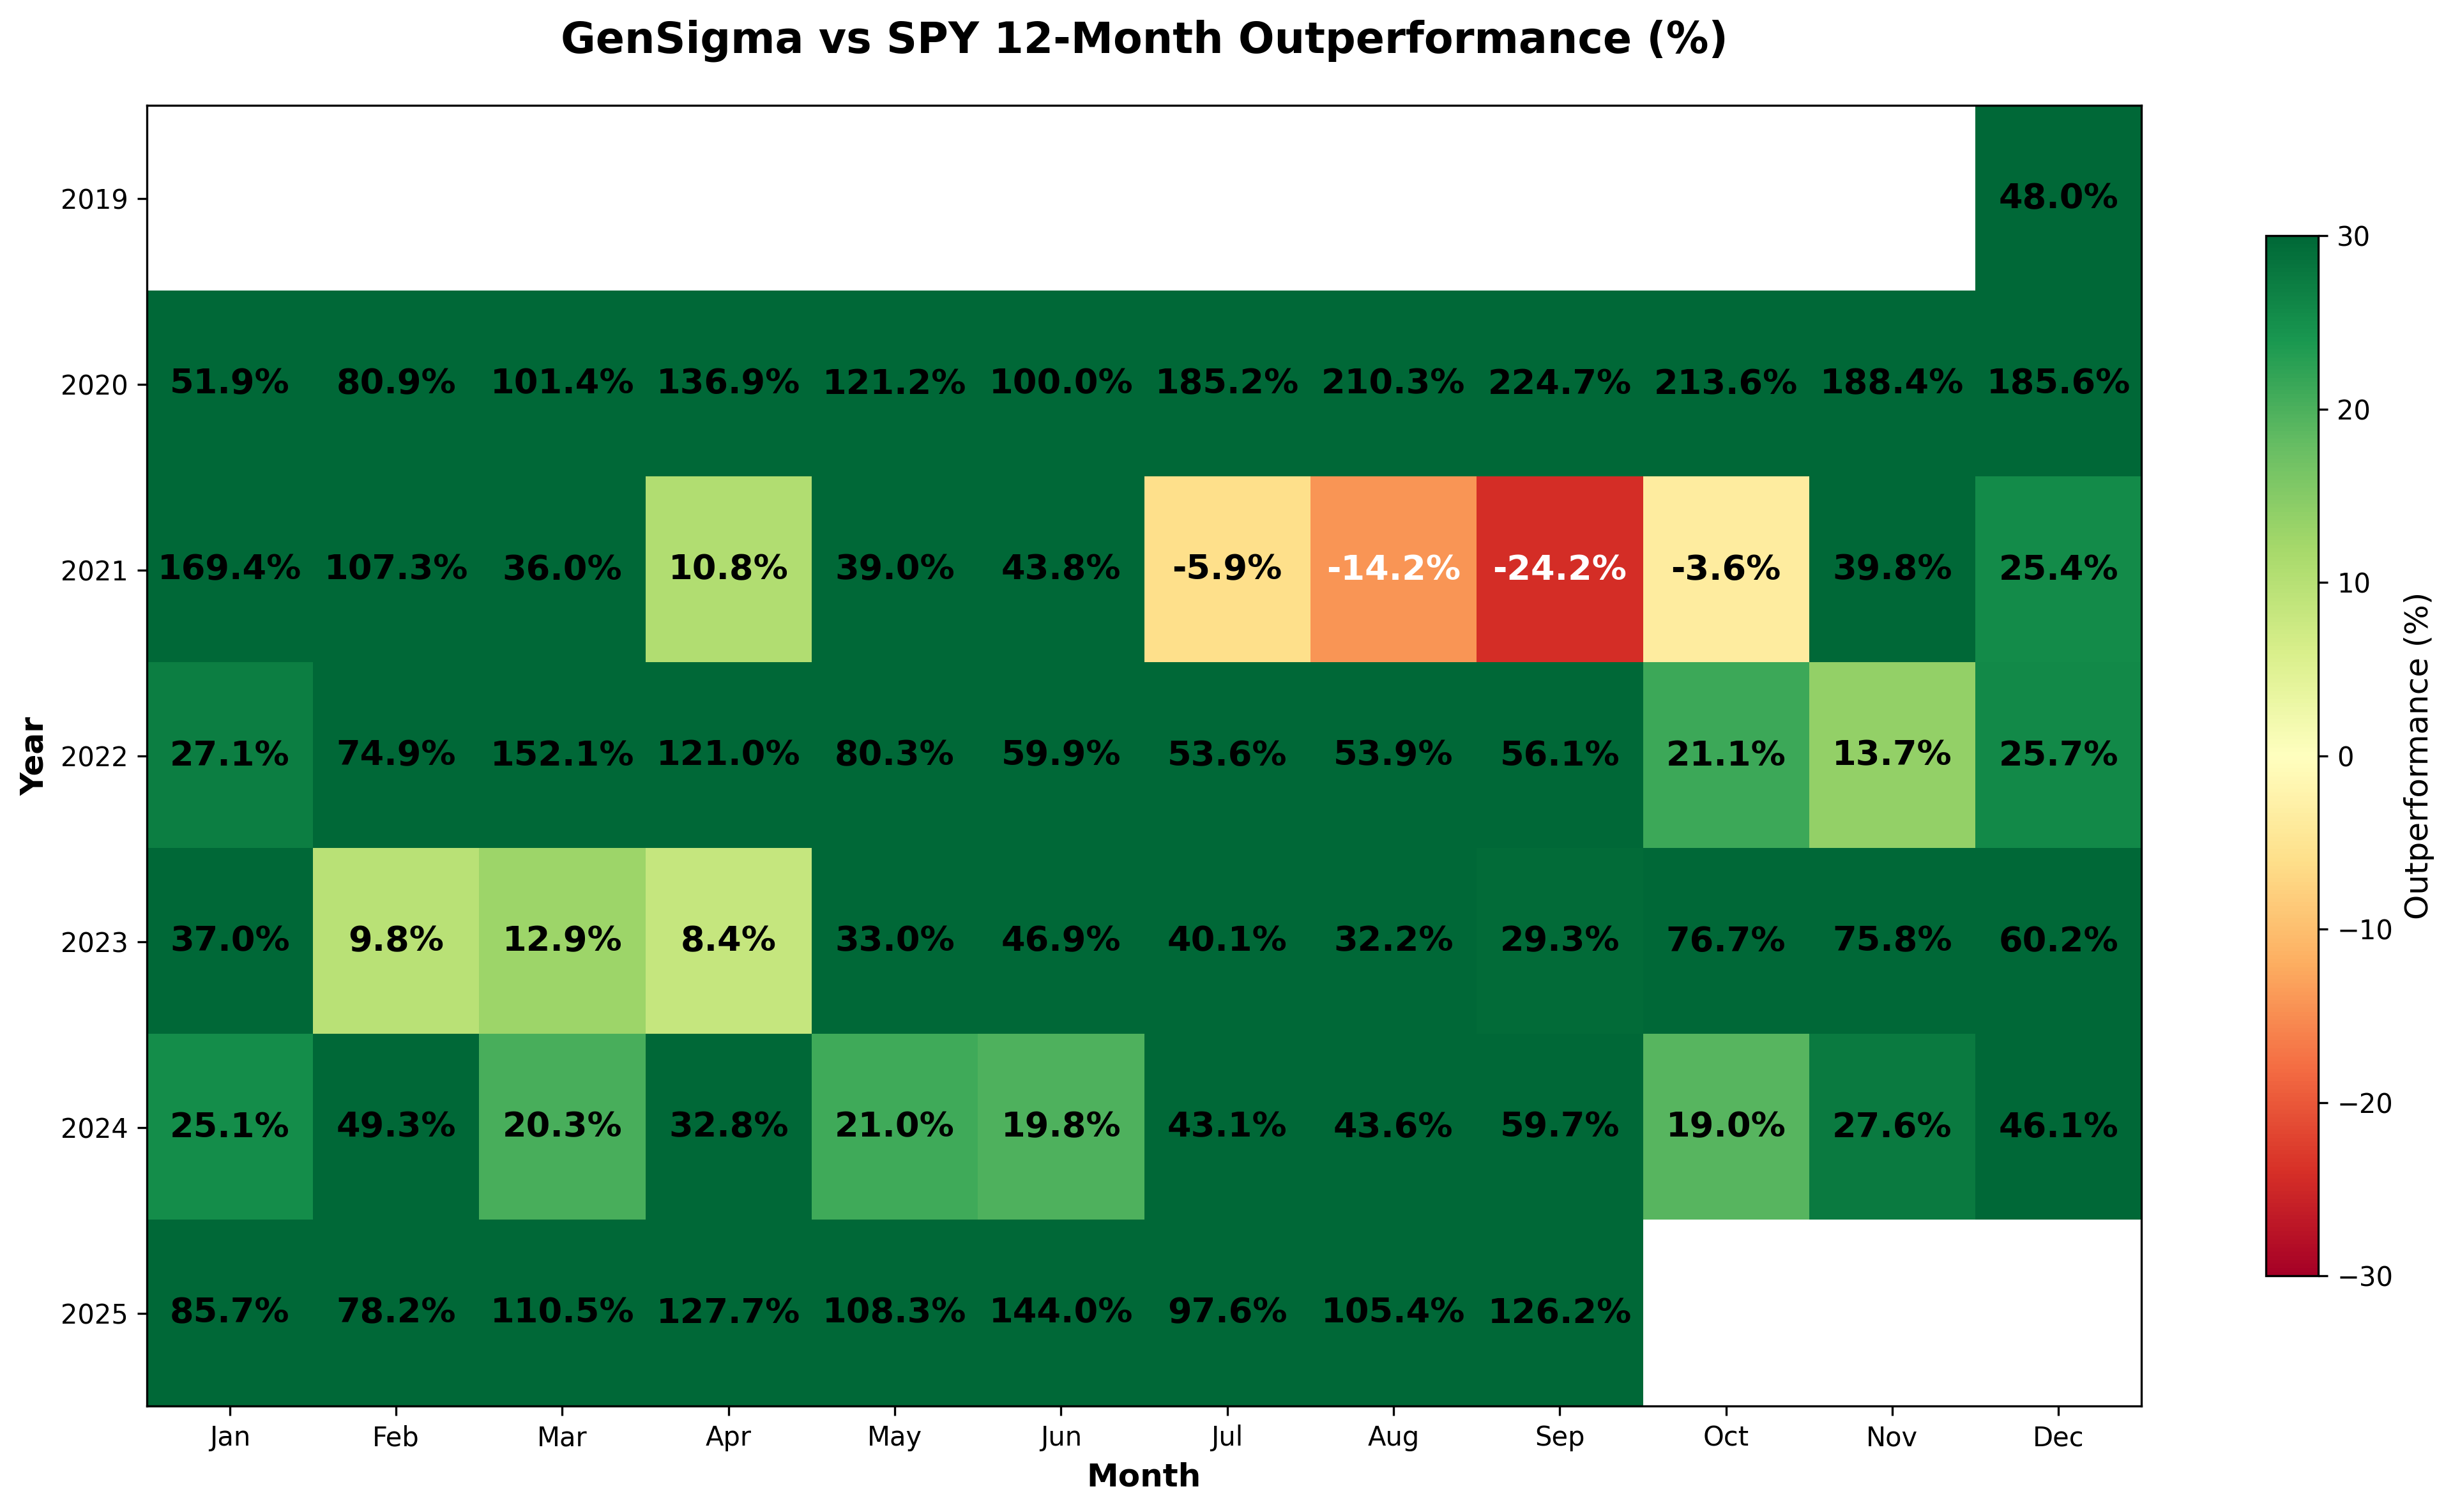
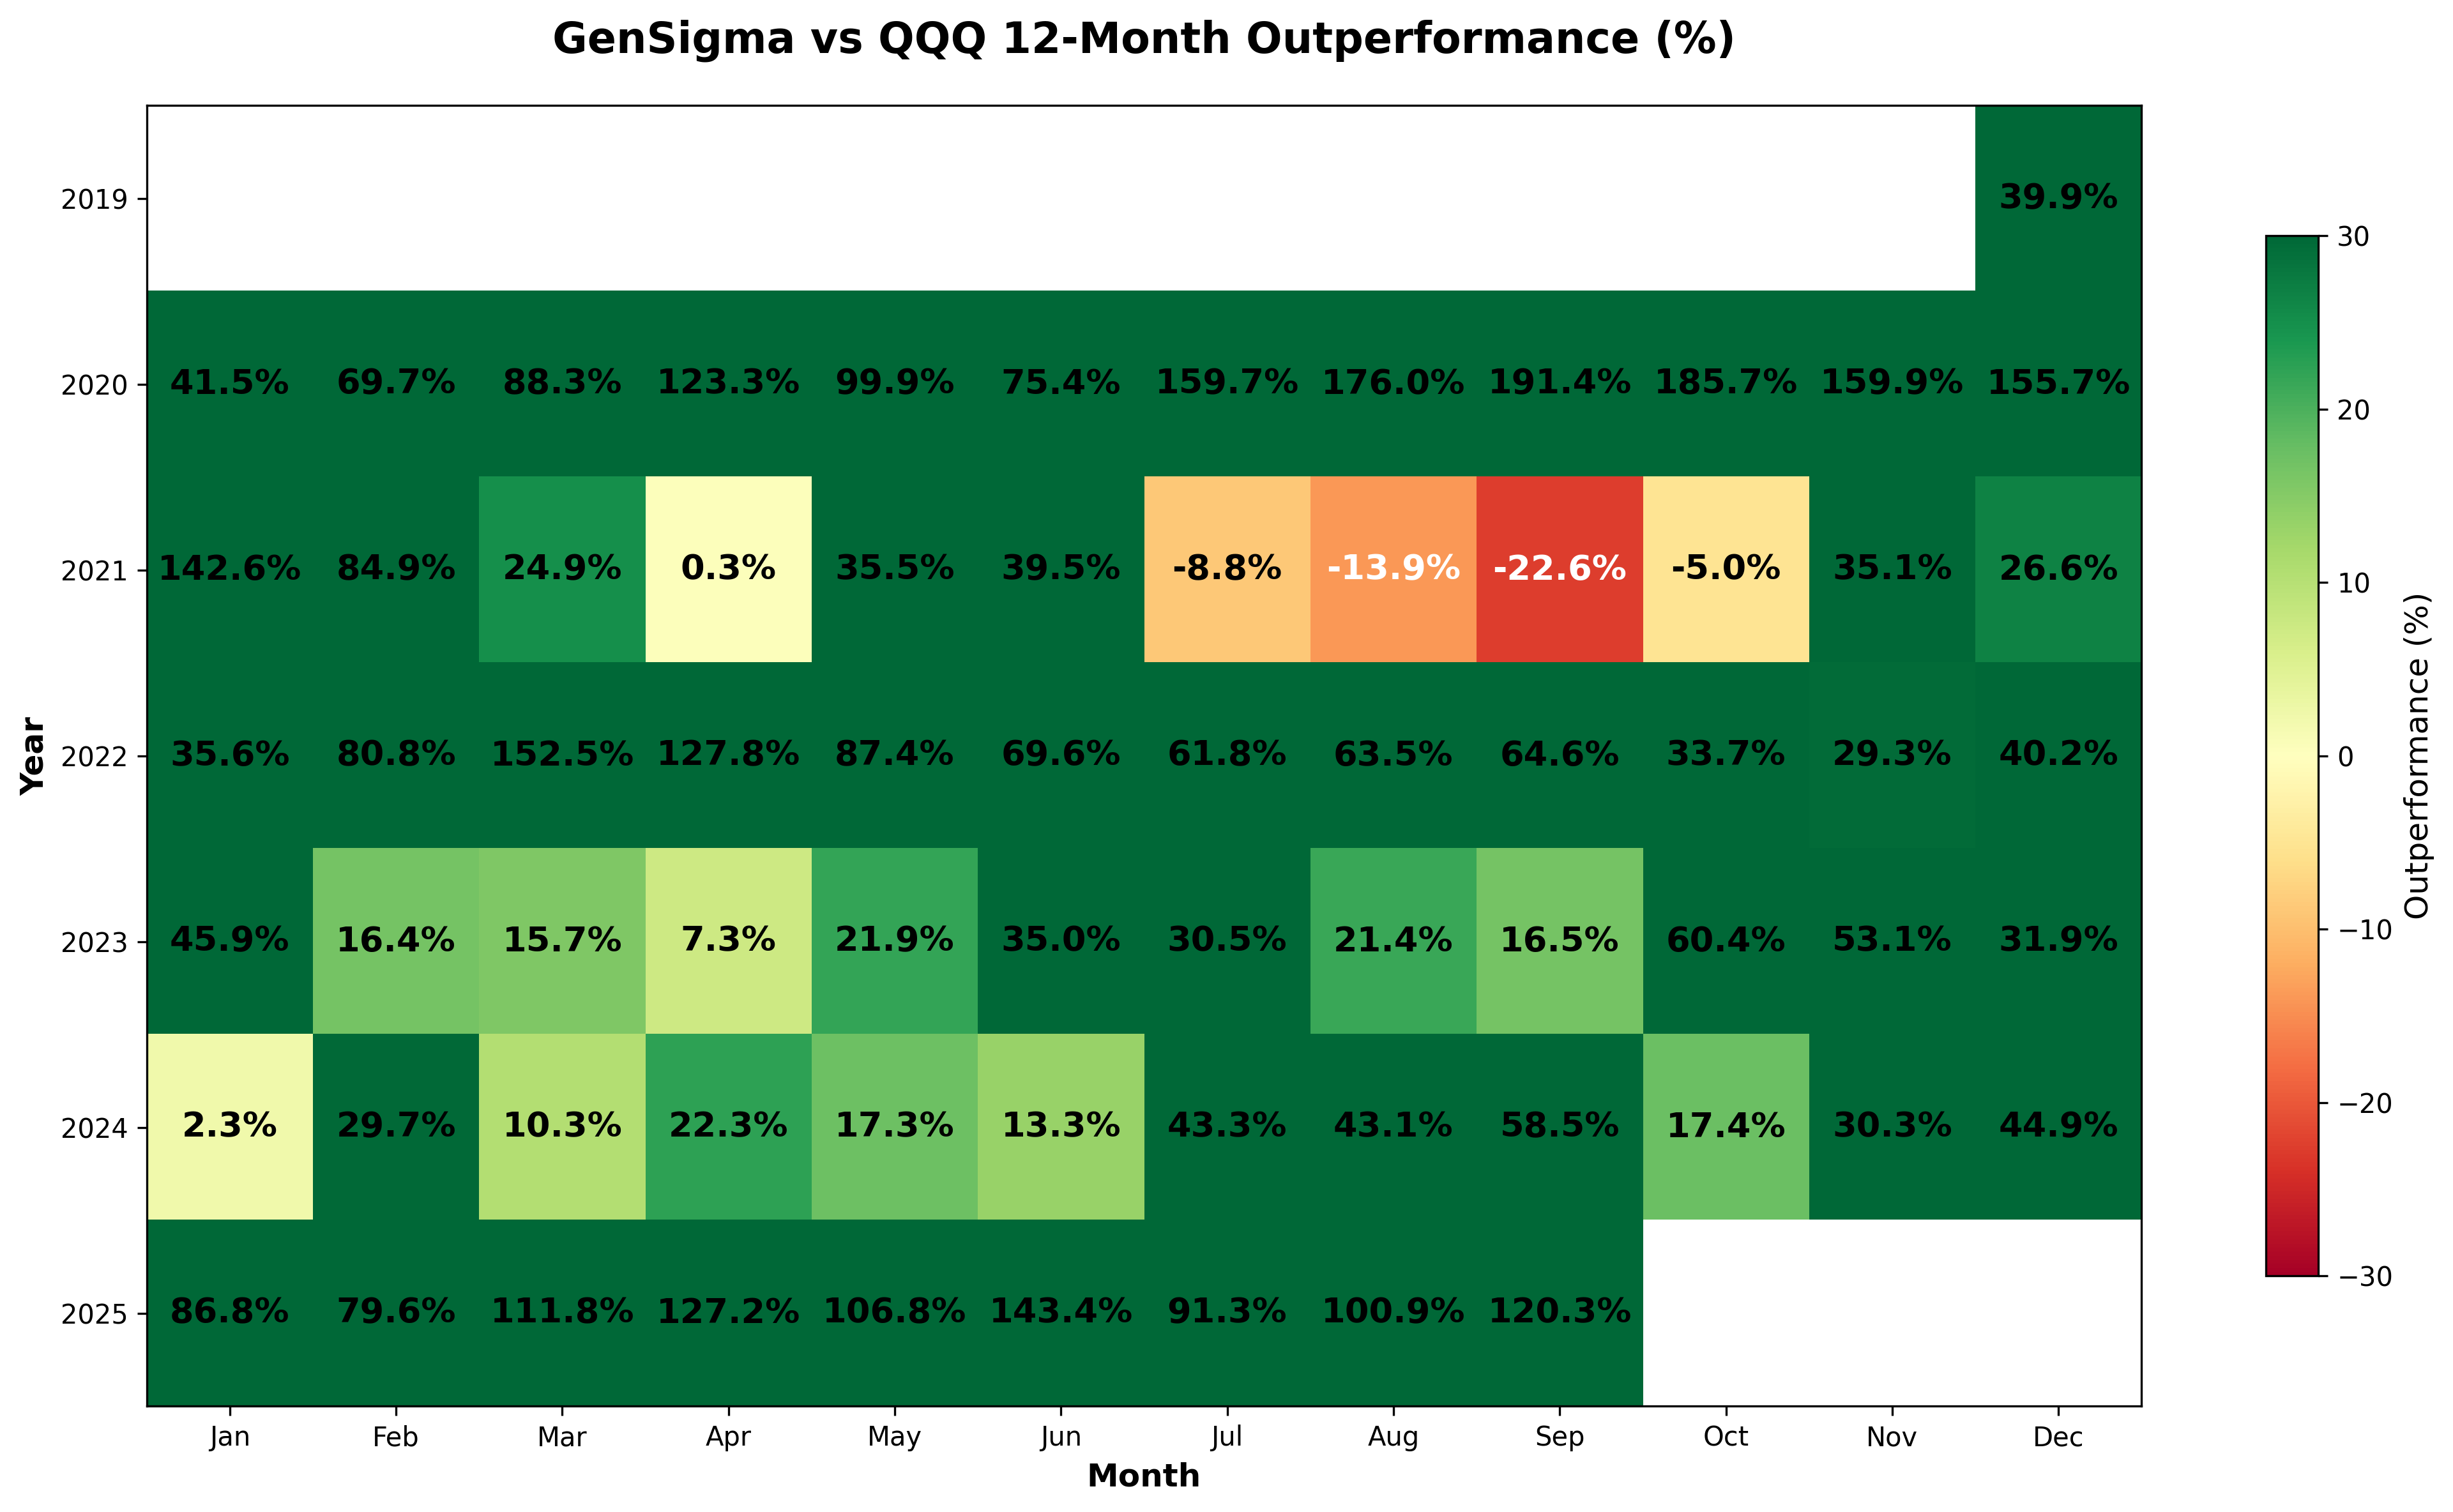
GenSigma - 12-Month Performance Analysis
Click on the individual image to enlarge
How to Read These Charts: The individual portfolio charts show 12-month returns for each strategy. The comparison charts (GenSigma vs Other Portfolio) display the difference in percentage returns between GenSigma and the other portfolio. A positive number indicates GenSigma performed better, while a negative number indicates the other portfolio performed better.
SPY
QQQ
GenSigma
GenSigma vs SPY
GenSigma vs QQQ
*2025 performance is hypothetical YTD as of September 30th, 2025. Past performance does not guarantee future results.
Ready to Take the High-Risk, High-Reward Path?
Start your high-flyer algorithmic trading journey with our proven GenSigma signals for daring investors.
