
QuantVantage.ai's marquee strategy that has outperformed every other long-term strategy available to retail traders to our knowledge. If you come across any external long-term strategy with a similar risk profile that has outperformed GenAlpha, please let us know and we will send you a token of appreciation. This strategy trades leveraged ETFs such as TQQQ.
Performance Metrics
Performance results from January 2019 through December 2025 are based on backtested data. 2026 results through May 31, 2026 reflect actual signals sent to subscribers. Past performance does not guarantee future results.
GenAlpha vs. S&P 500/Nasdaq-100
Jan 1, 2019 to Feb 27, 2026
*SPY is the SPDR S&P 500 ETF Trust, which tracks the S&P 500 index | QQQ is the Invesco QQQ Trust, which tracks the Nasdaq-100 Index
Performance results from January 2019 through December 2025 are based on backtested data. 2026 results through May 31, 2026 reflect actual signals sent to subscribers. Past performance does not guarantee future results.
GenAlpha Annual Returns vs. Benchmarks (SPY & QQQ)
SPY ETF tracks S&P 500 index | QQQ ETF tracks Nasdaq-100 Index
Performance results from January 2019 through December 2025 are based on backtested data. 2026 results through May 31, 2026 reflect actual signals sent to subscribers. Past performance does not guarantee future results.
Performance Data & Analysis
Detailed historical performance metrics and investment growth analysis.
Investment Growth
Growth of $10,000 invested in SPY, QQQ, or GenAlpha.
Performance results from January 2019 through December 2025 are based on backtested data. 2026 results through May 31, 2026 reflect actual signals sent to subscribers. Past performance does not guarantee future results.
Annual Performance vs. Benchmarks
Year-over-year returns comparison.
Performance results from January 2019 through December 2025 are based on backtested data. 2026 results through May 31, 2026 reflect actual signals sent to subscribers. Past performance does not guarantee future results.
GenAlpha Performance
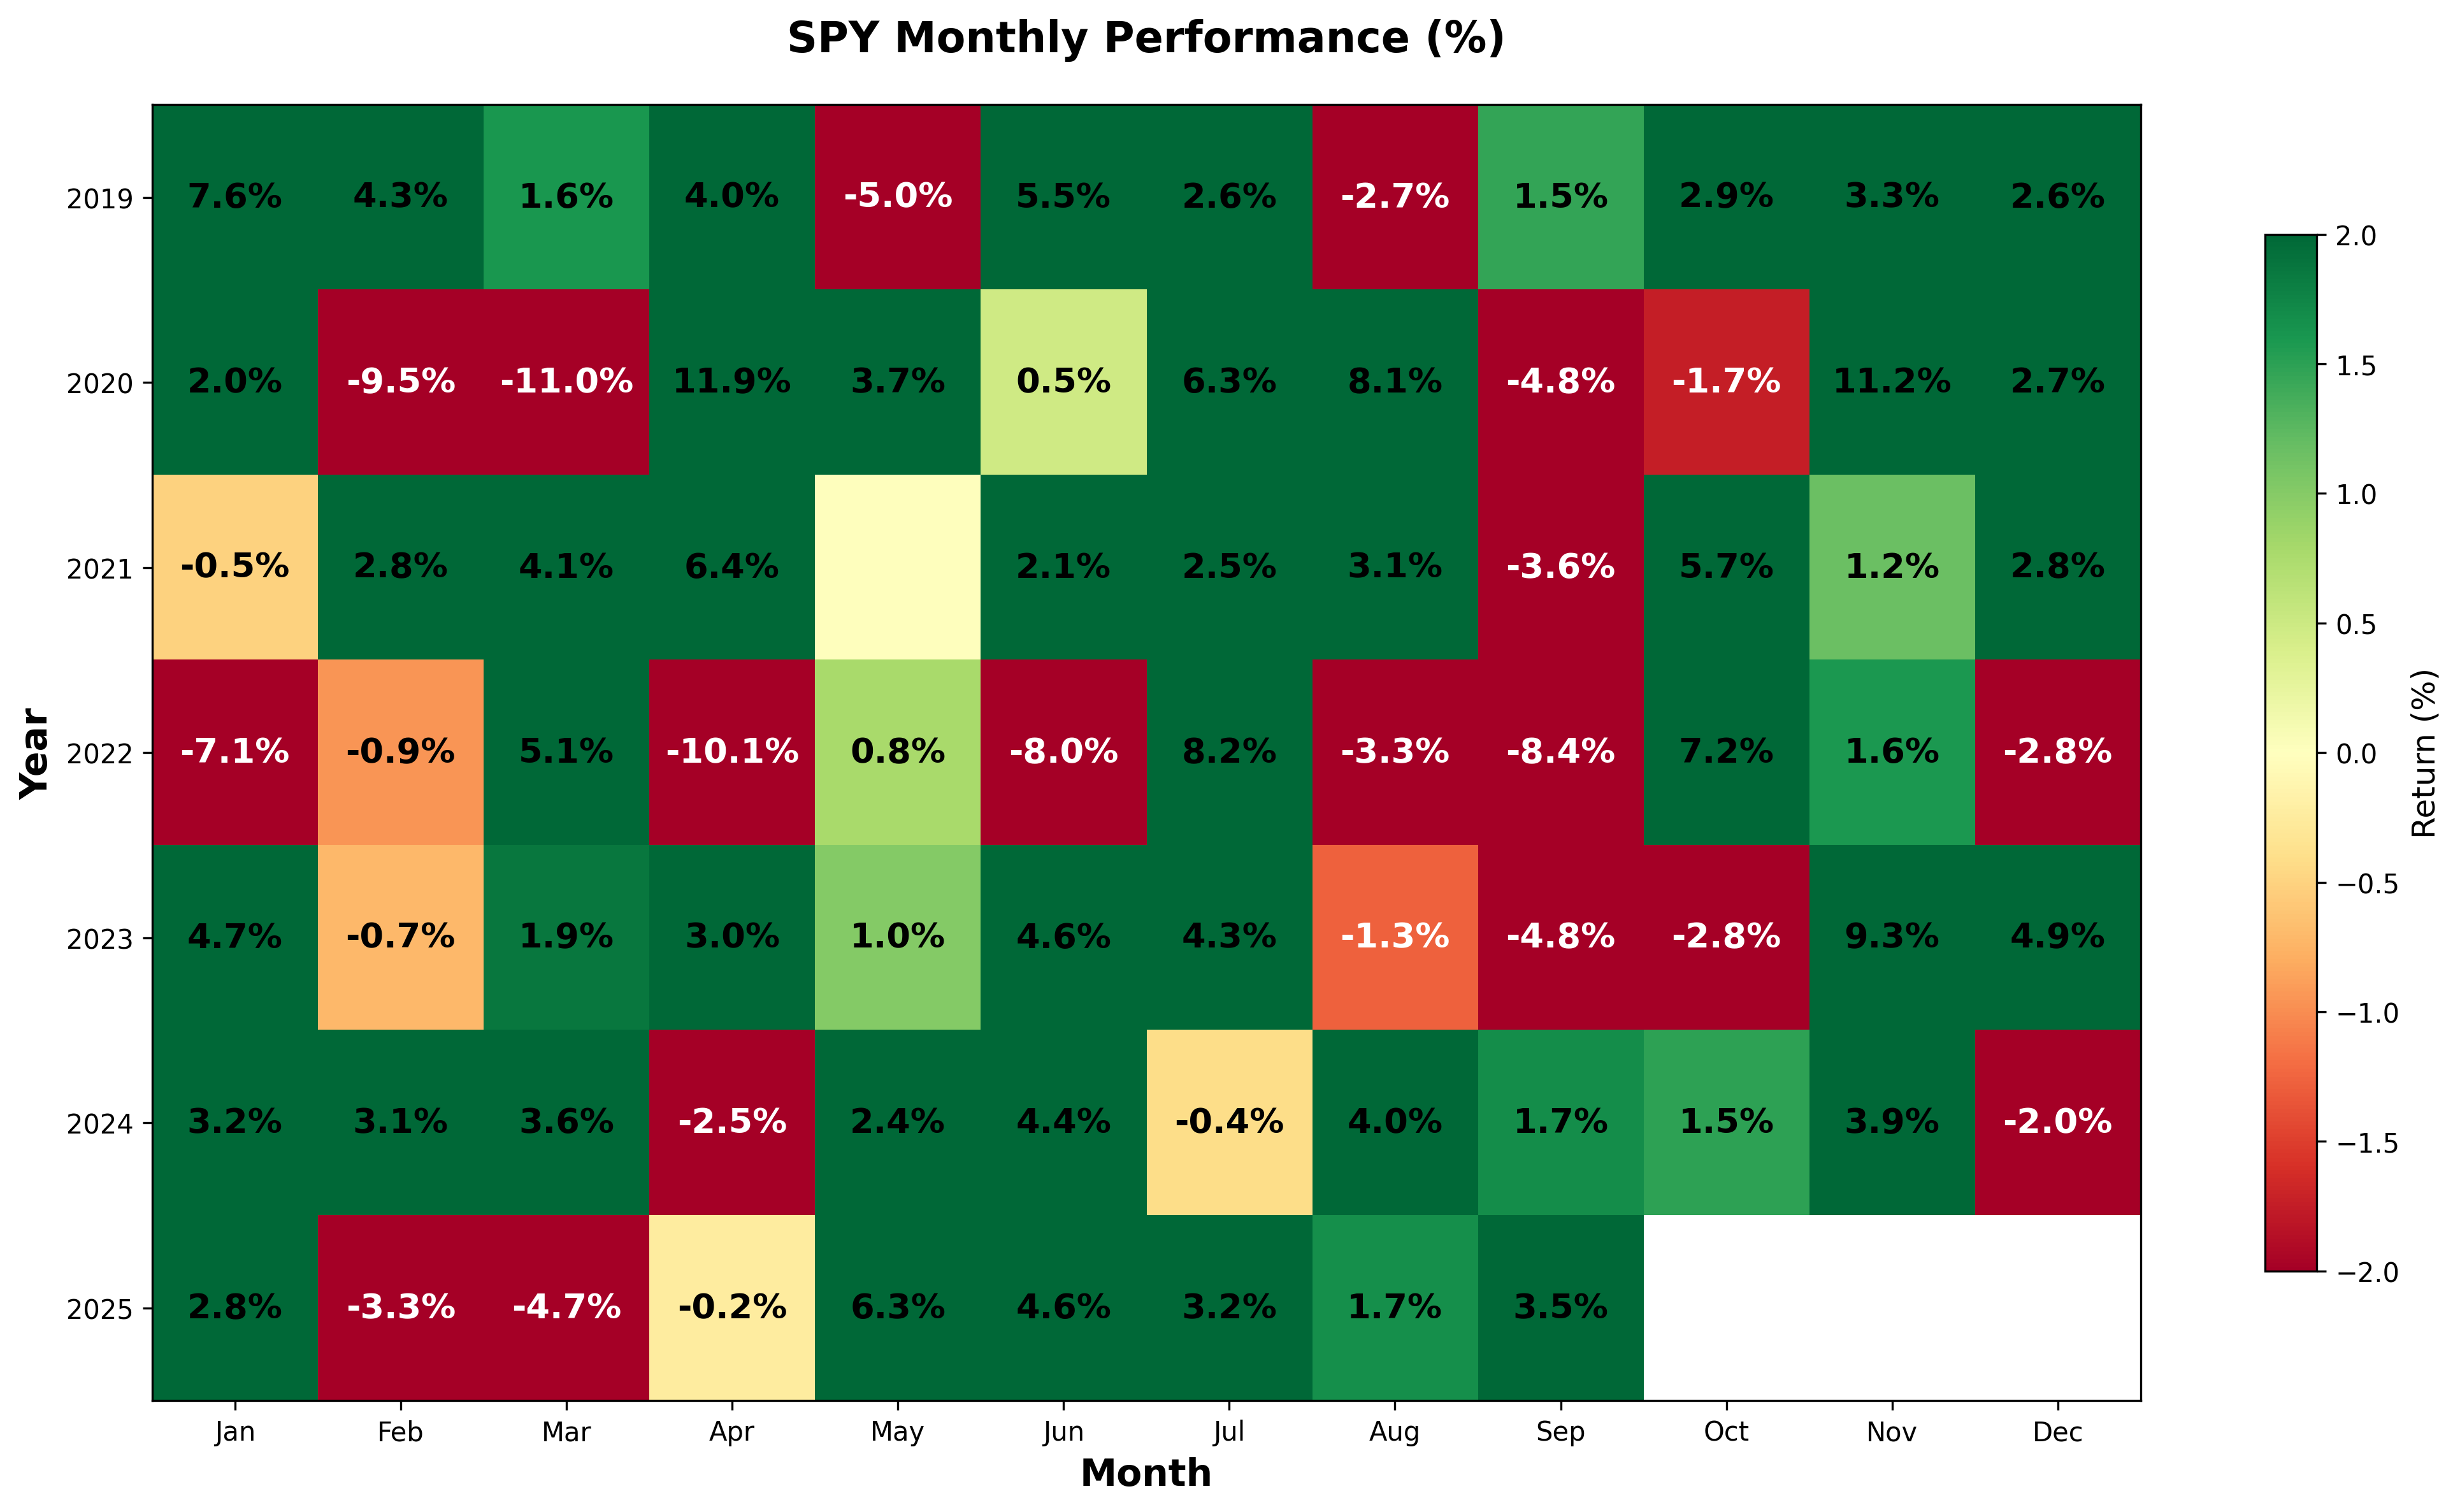
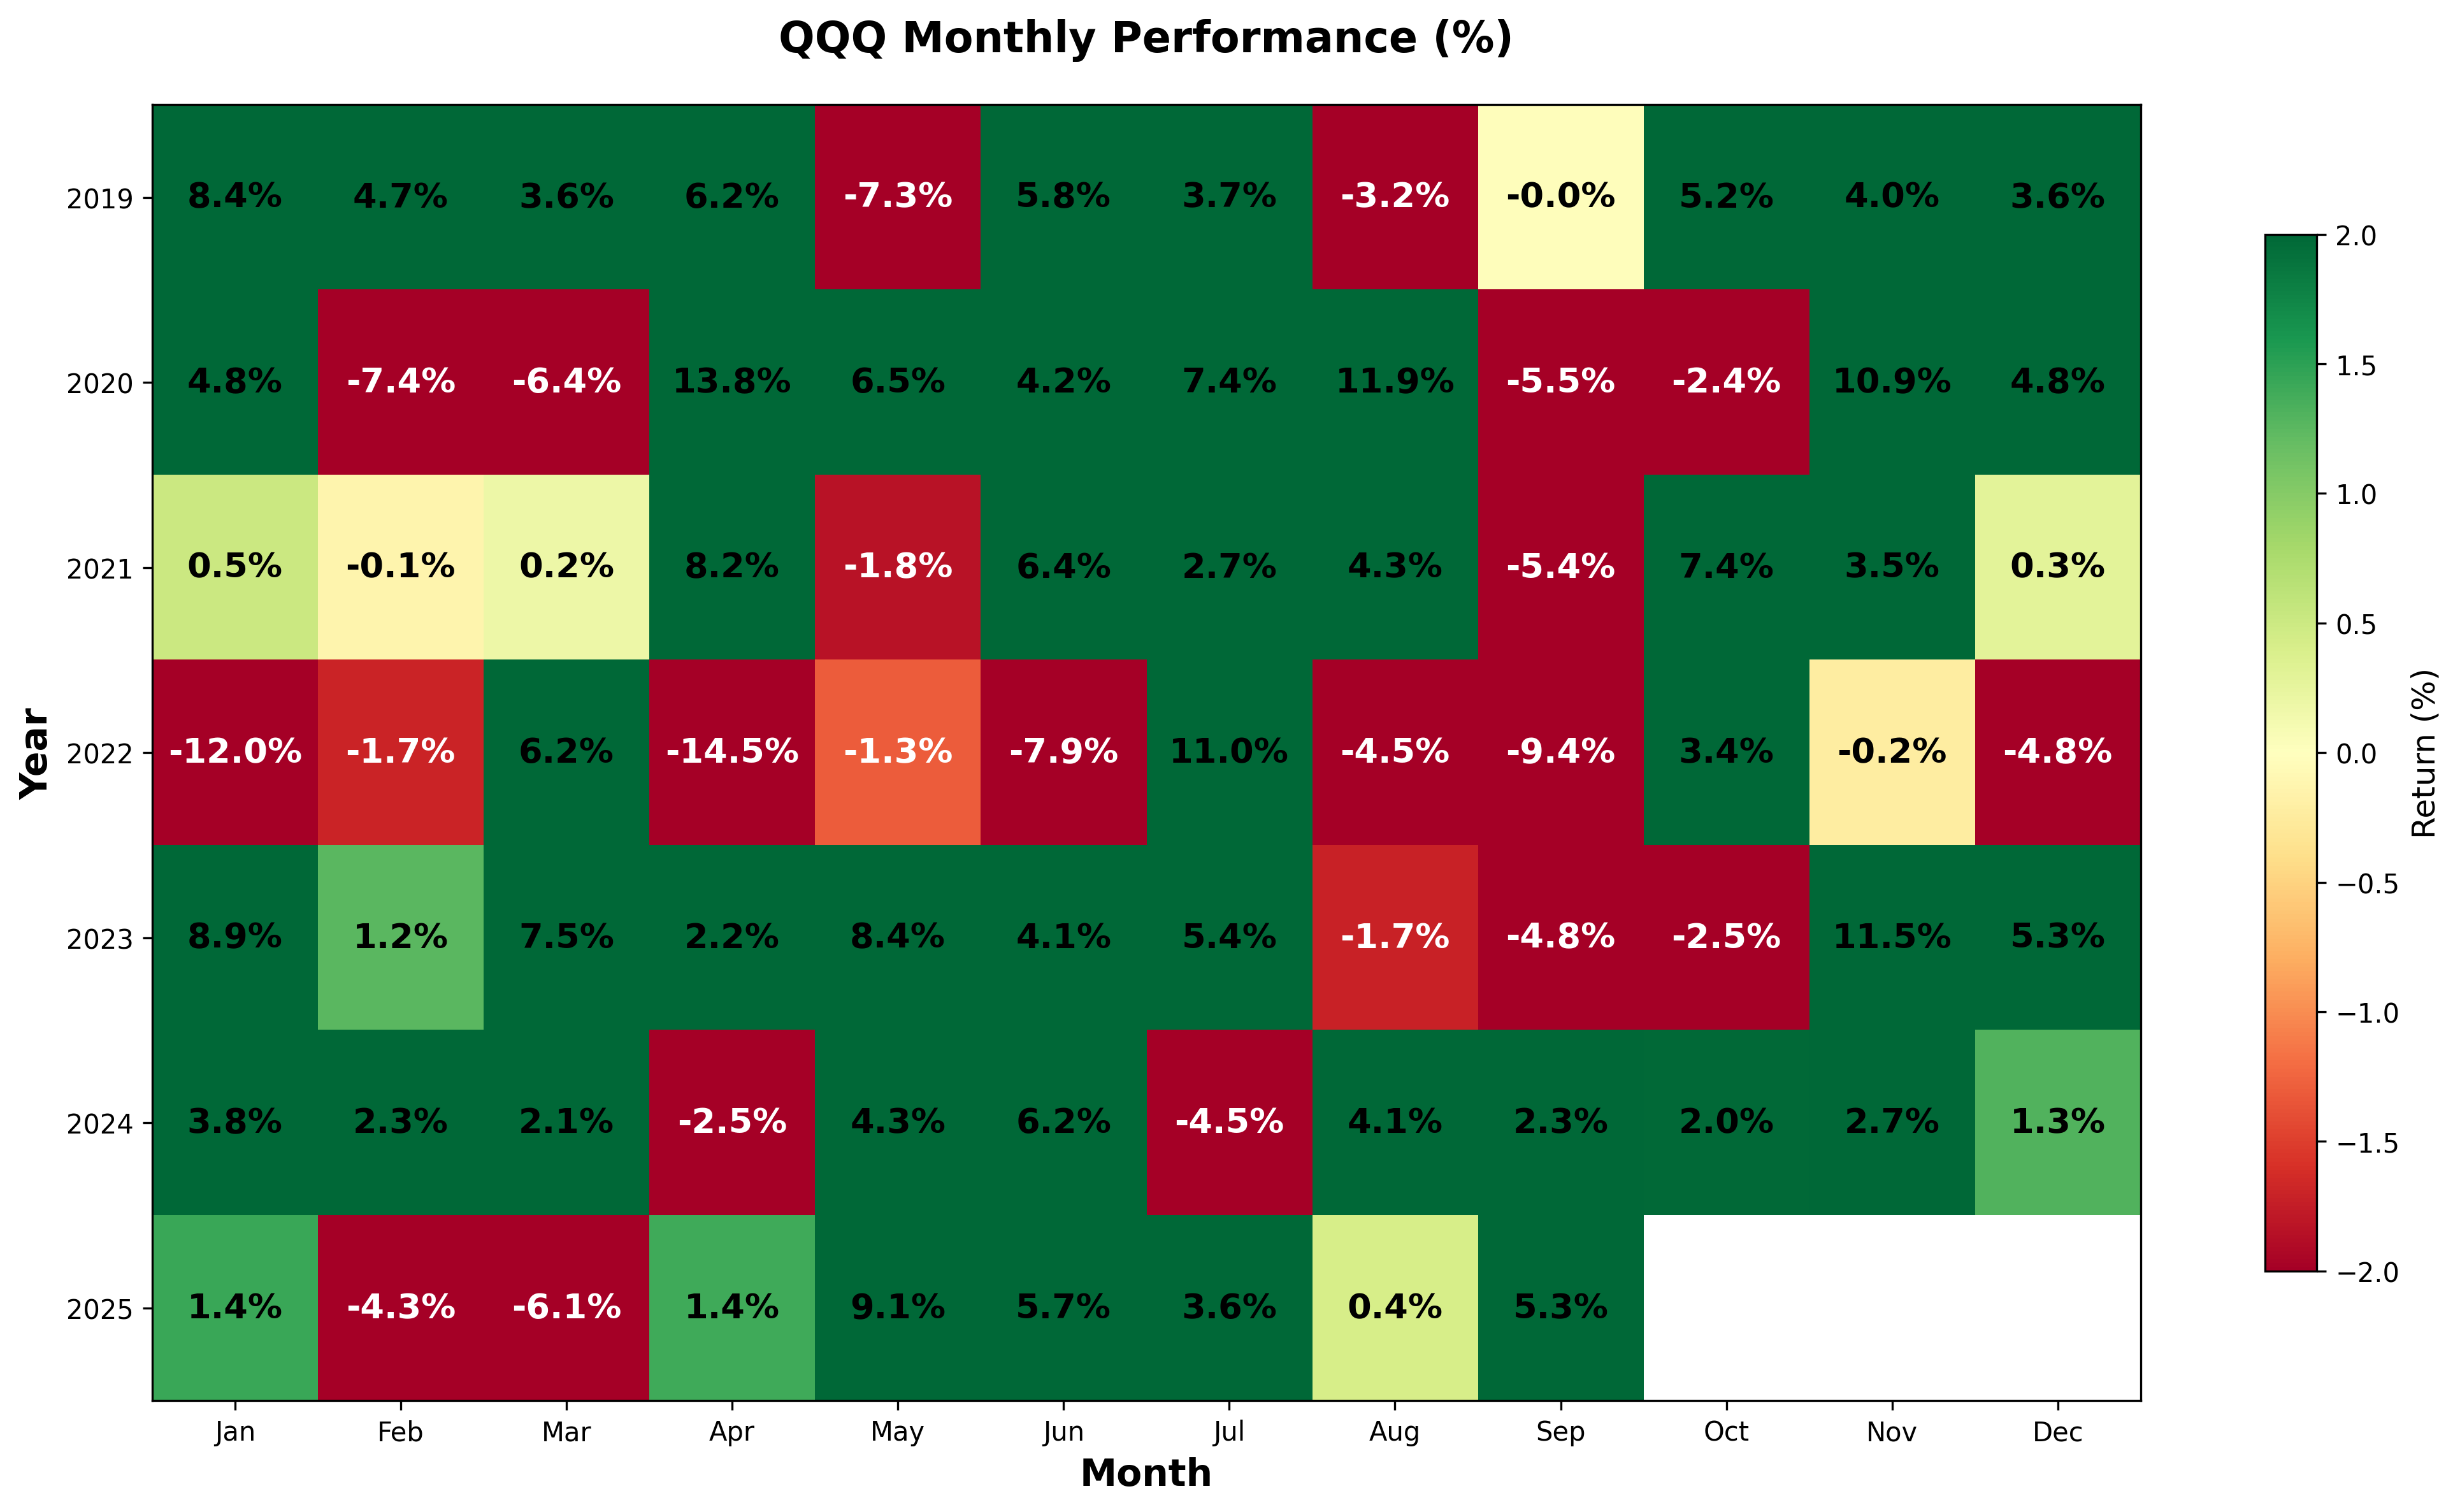
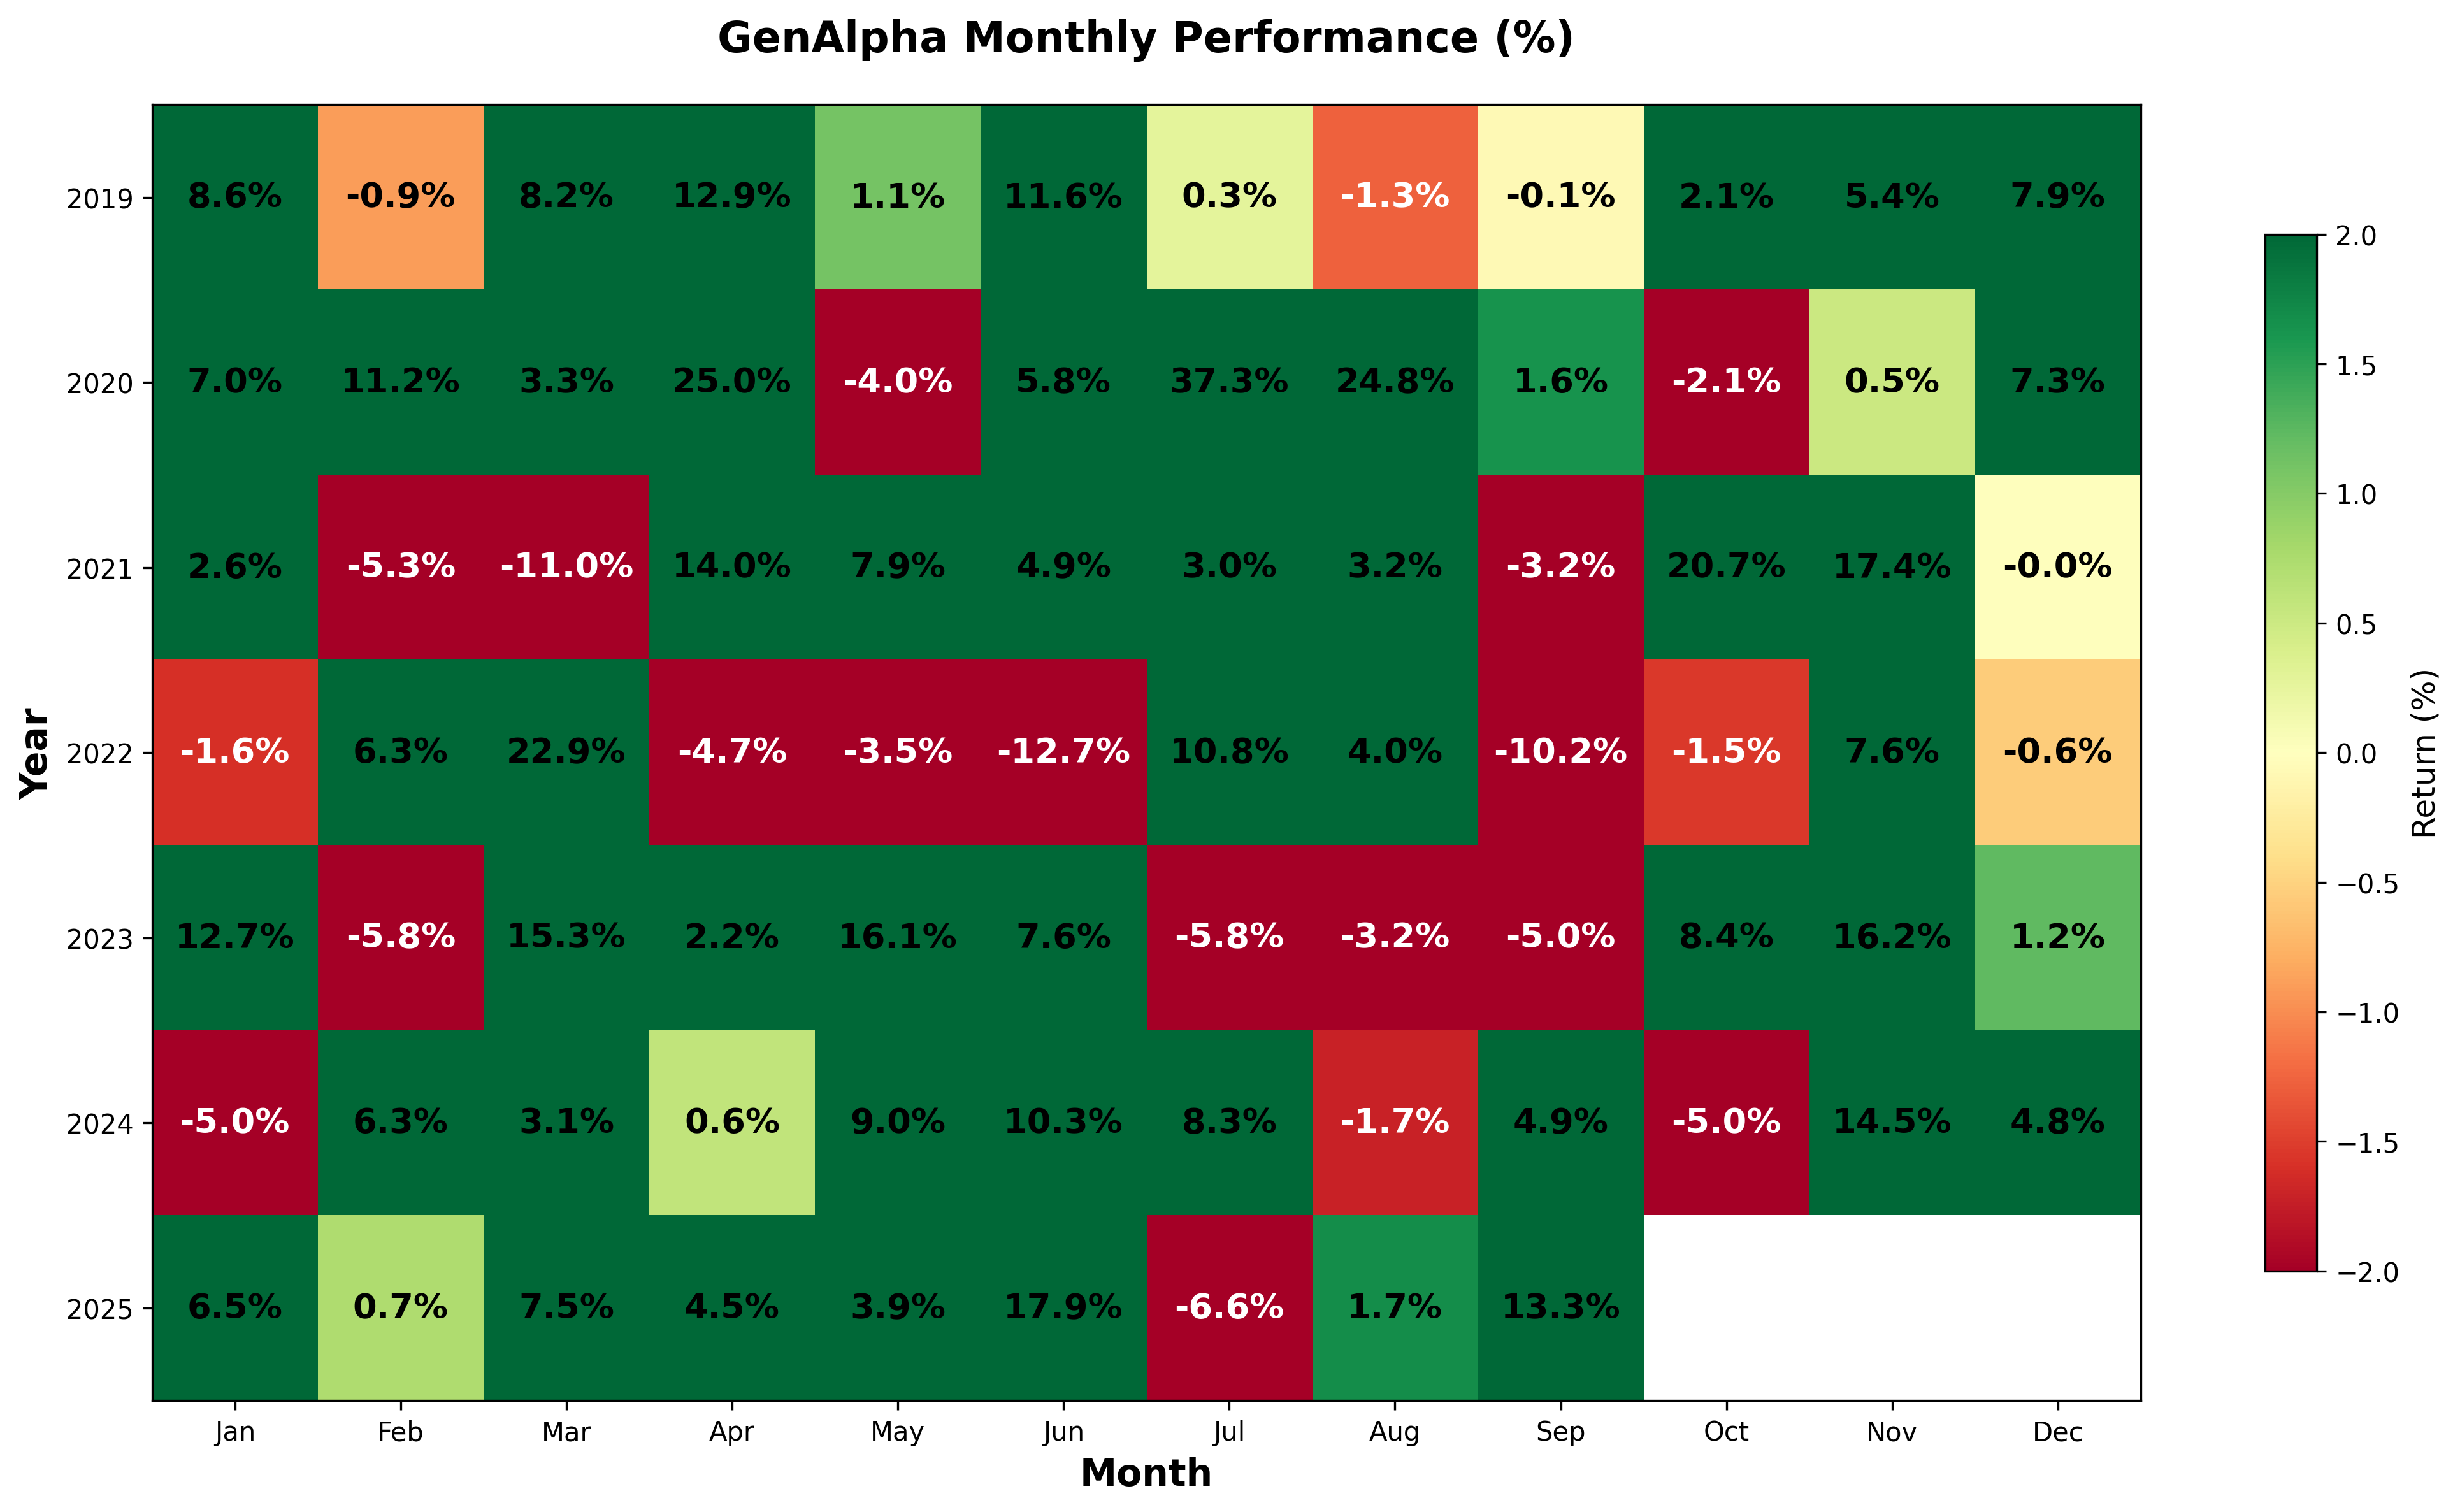
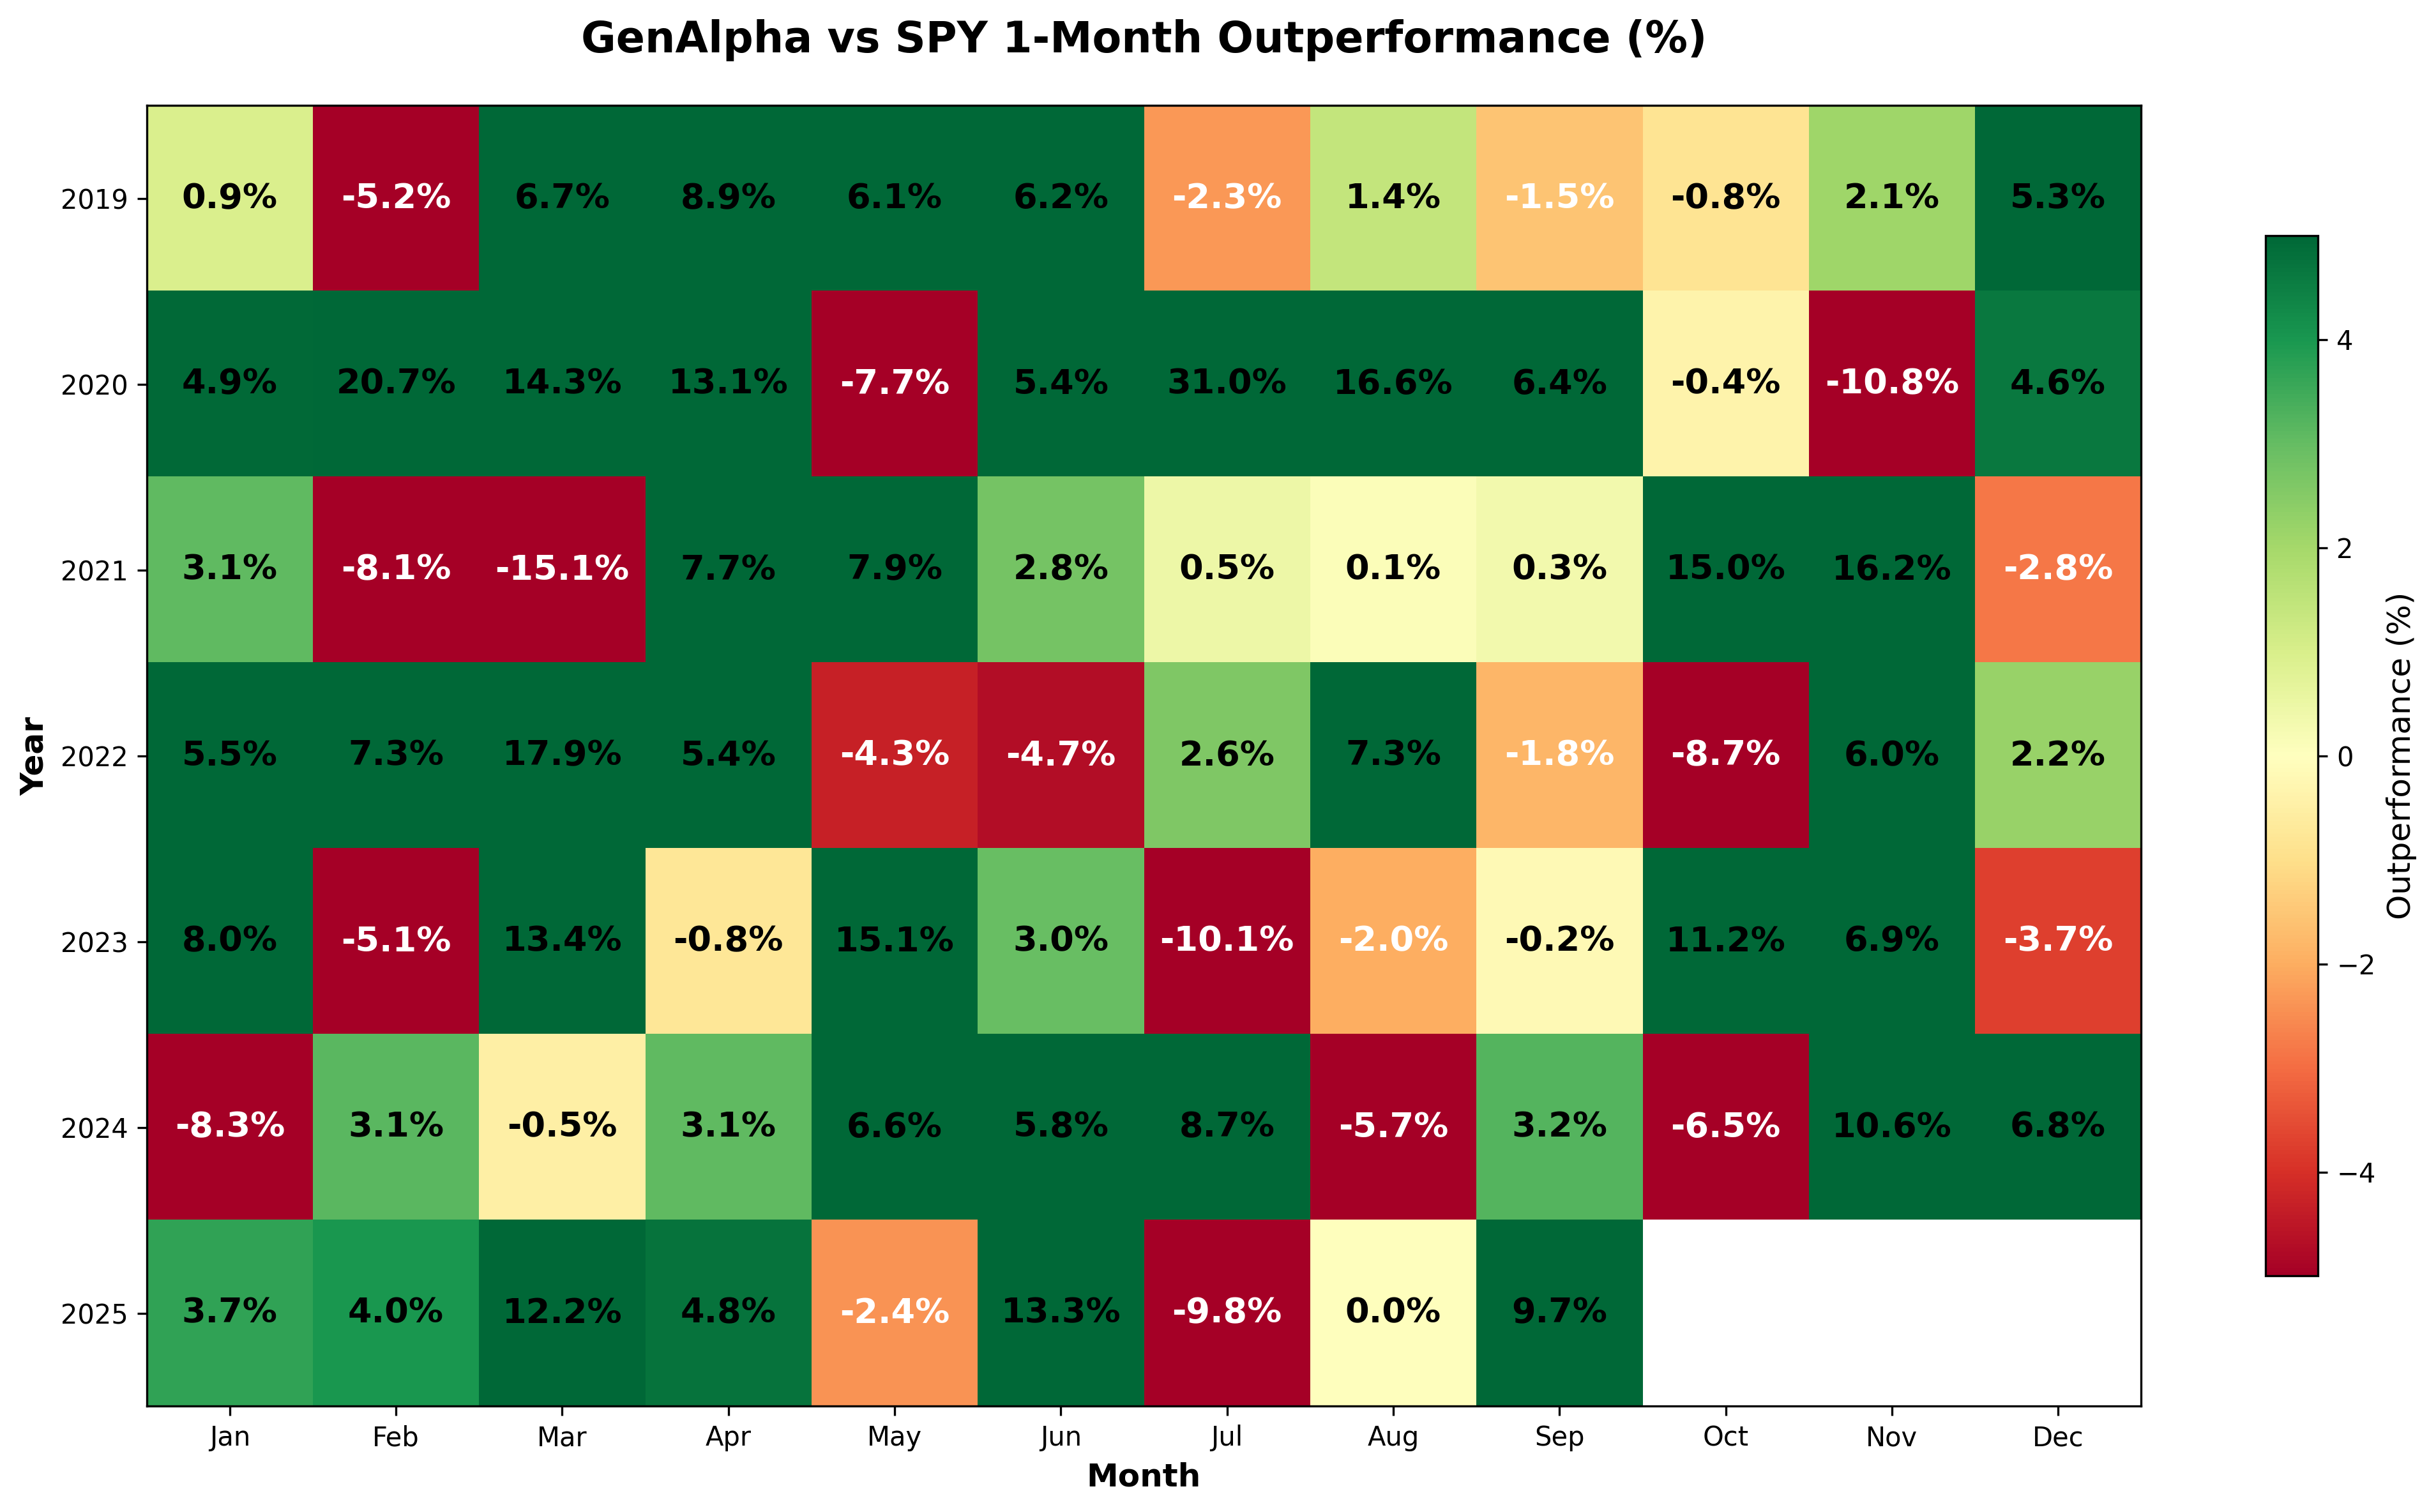
GenAlpha - 1-Month Performance Analysis
Click on the individual image to enlarge
How to Read These Charts: The individual portfolio charts show monthly returns for each strategy. The comparison charts (GenAlpha vs Other Portfolio) display the difference in percentage returns between GenAlpha and the other portfolio. A positive number indicates GenAlpha performed better, while a negative number indicates the other portfolio performed better.
SPY
QQQ
GenAlpha
GenAlpha vs SPY
GenAlpha vs QQQ

Performance results from January 2019 through December 2025 are based on backtested data. 2026 results through May 31, 2026 reflect actual signals sent to subscribers. Past performance does not guarantee future results.
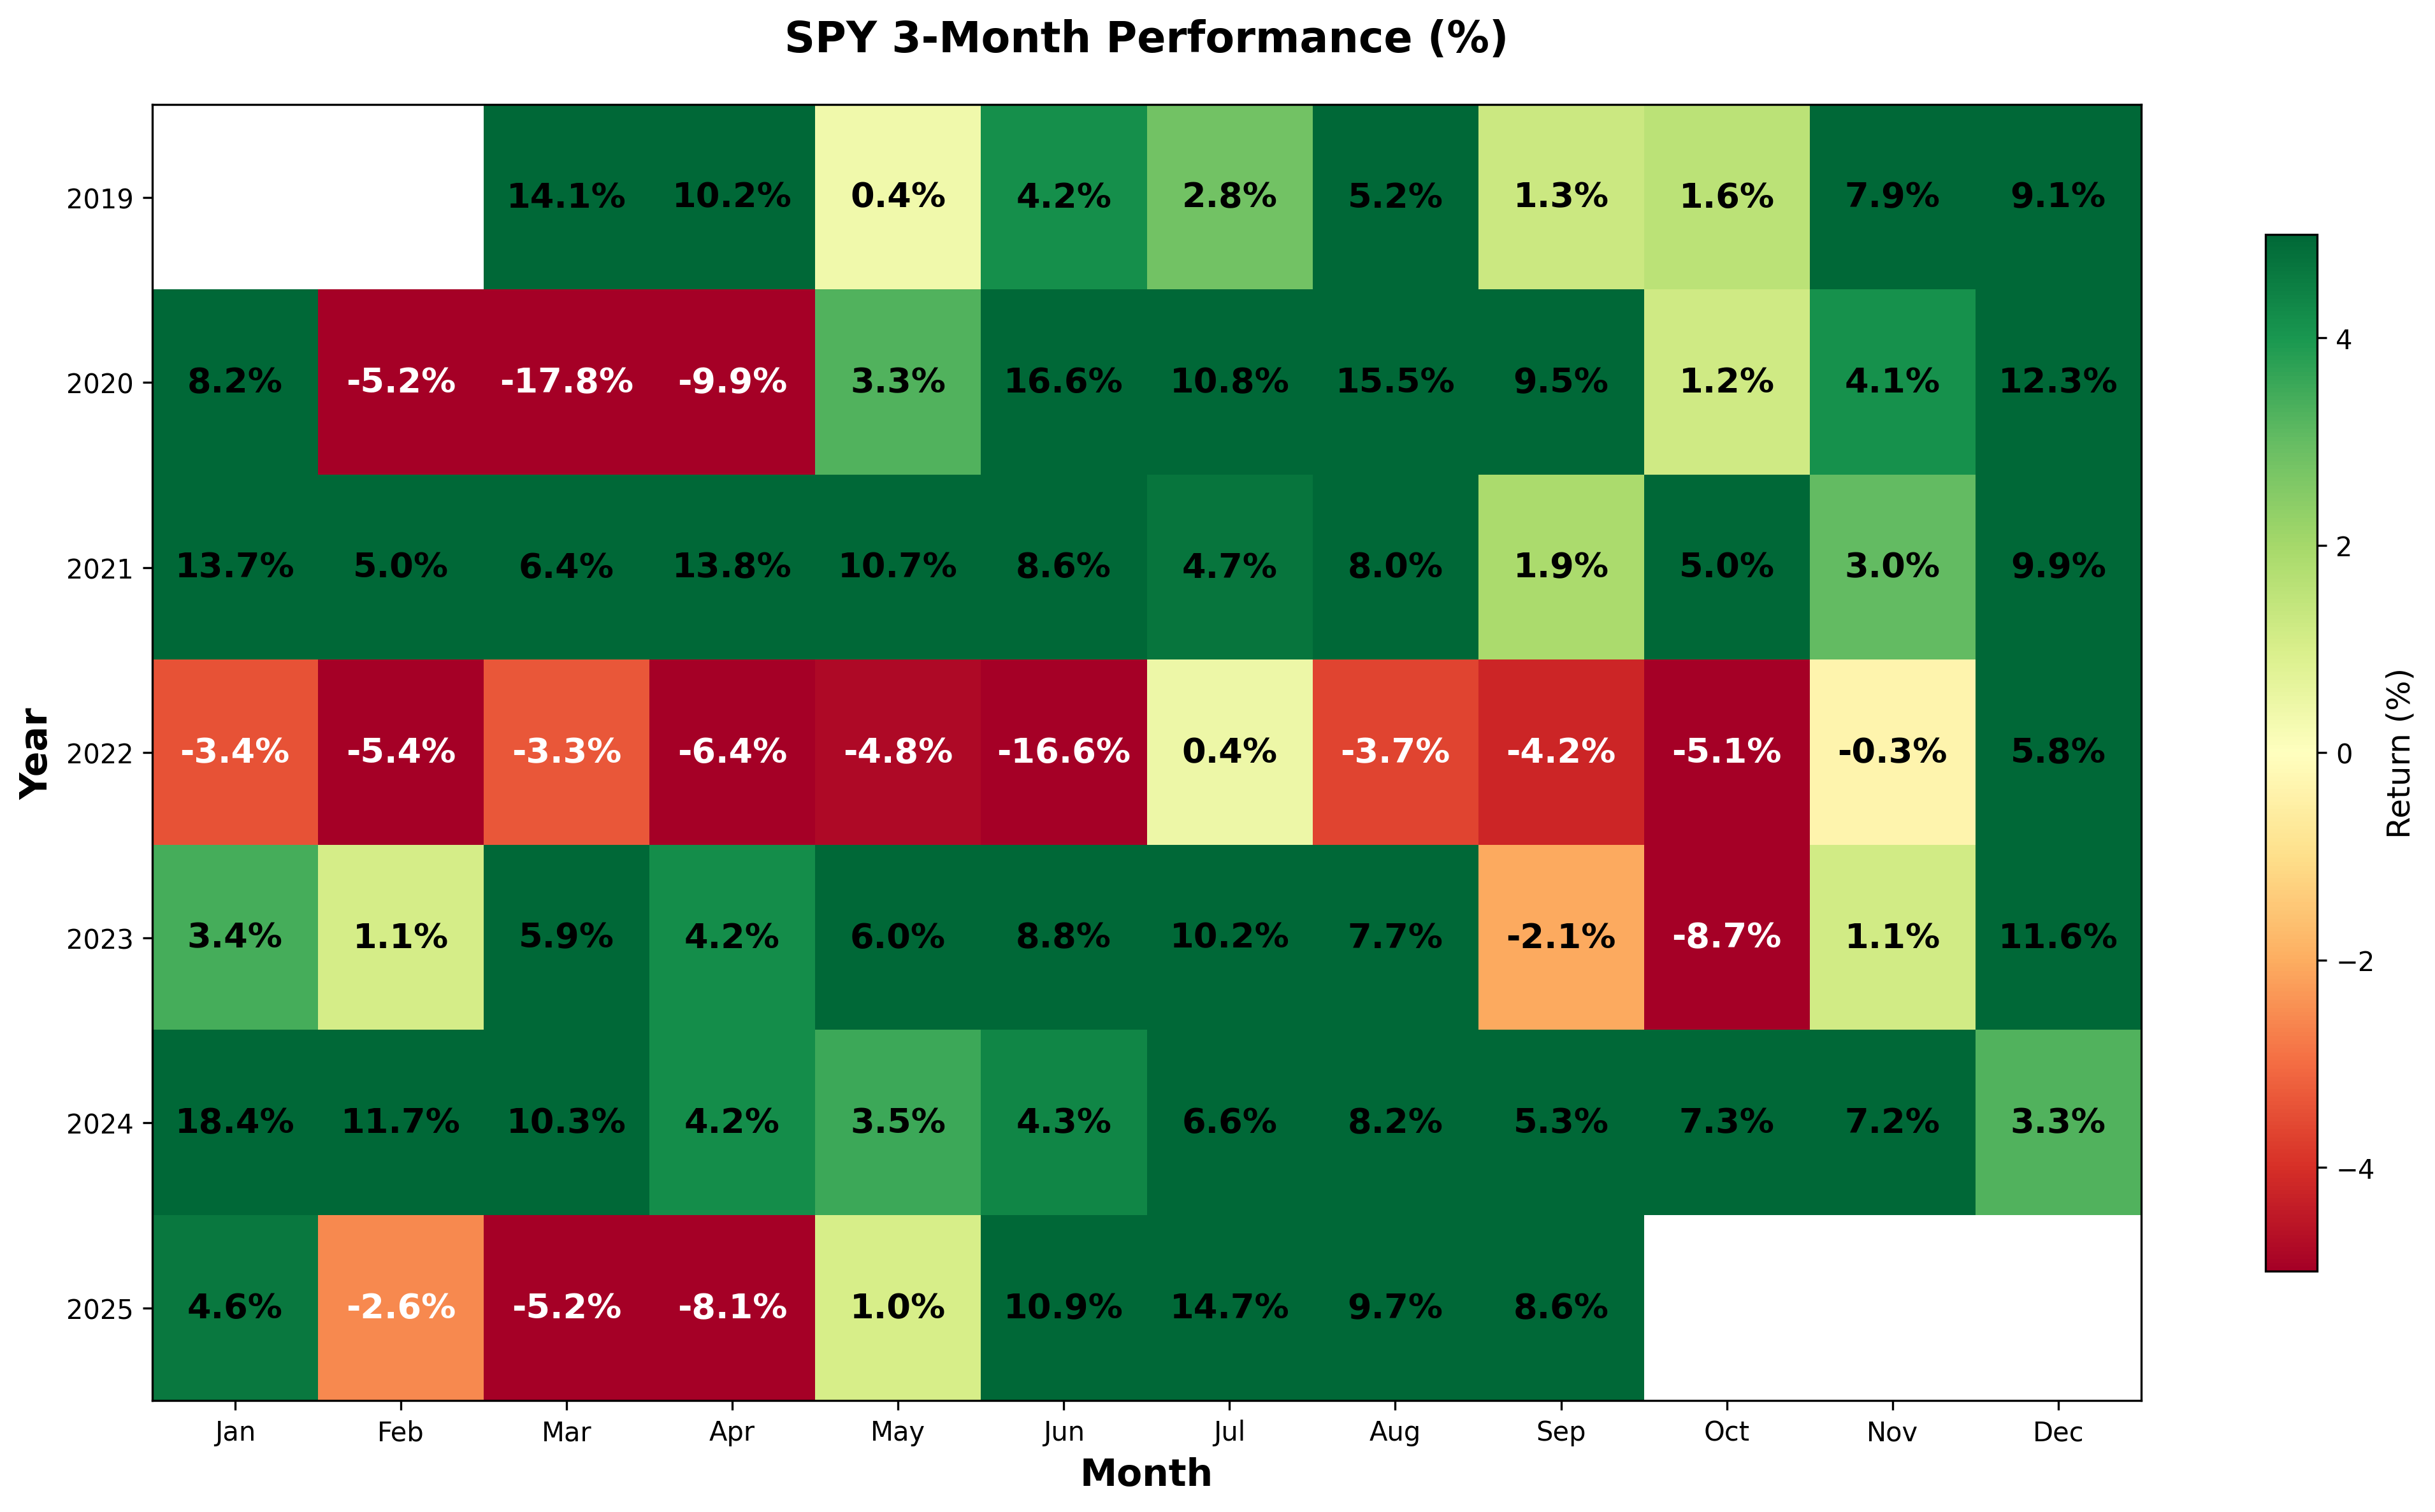
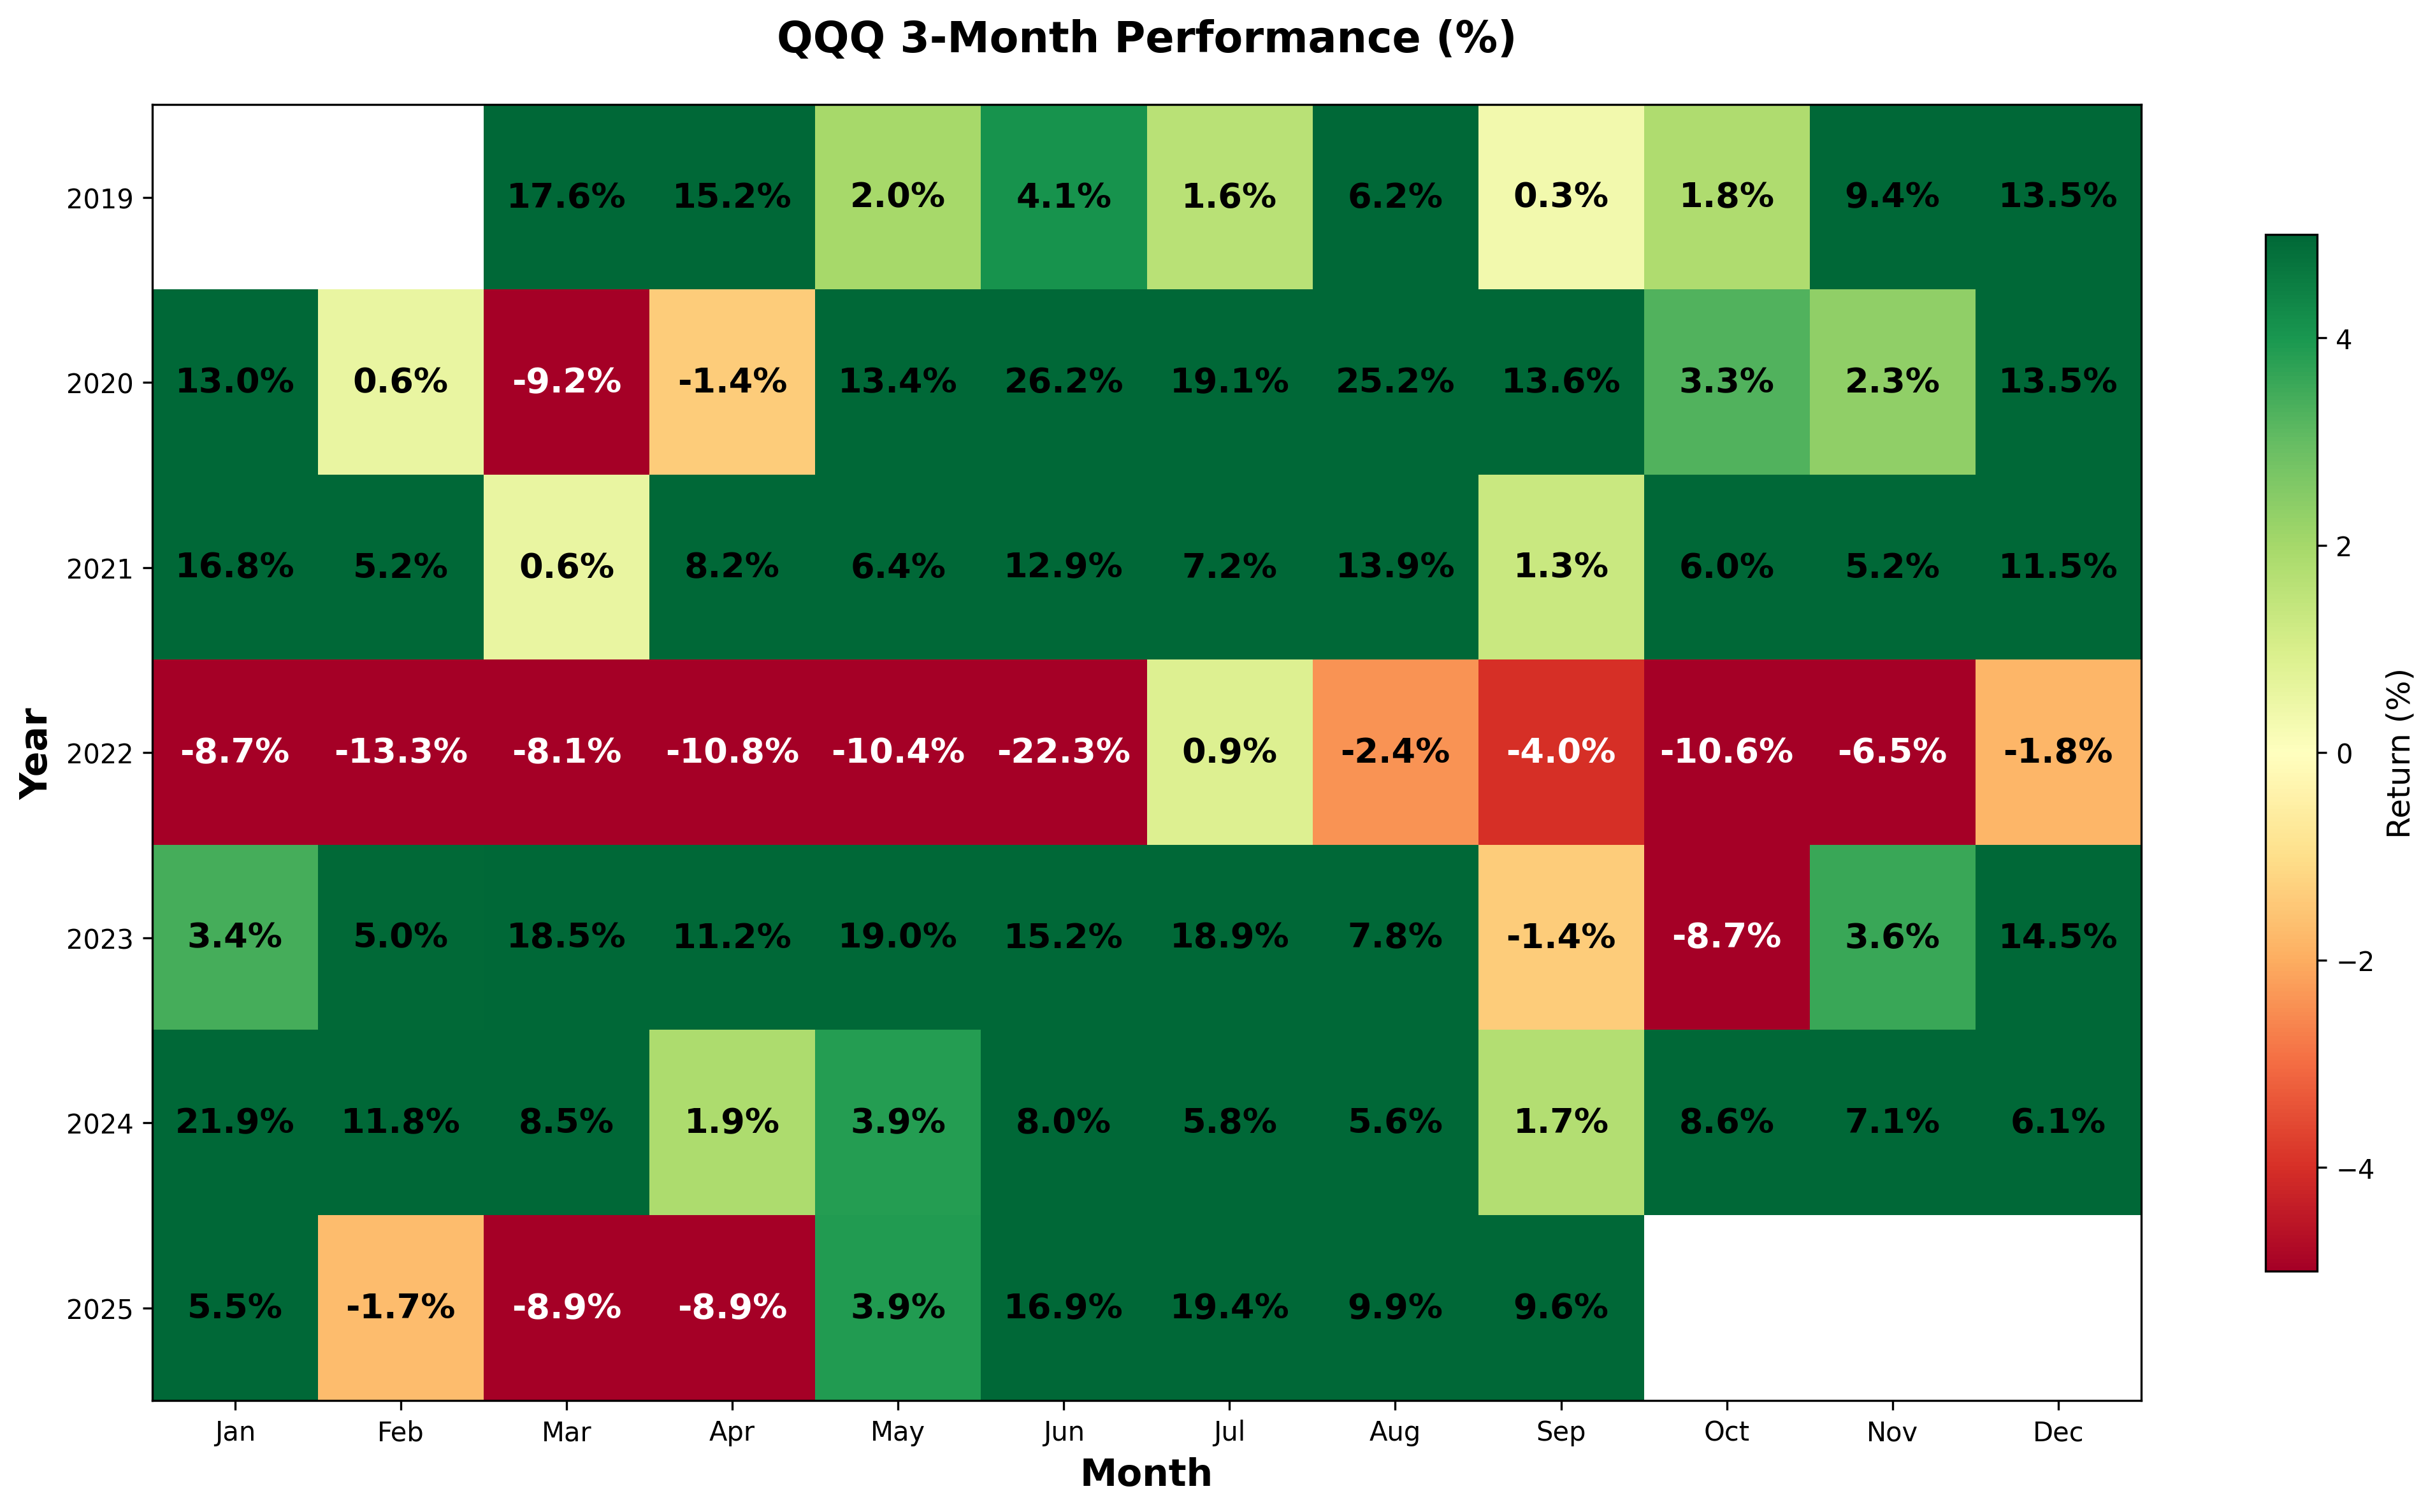
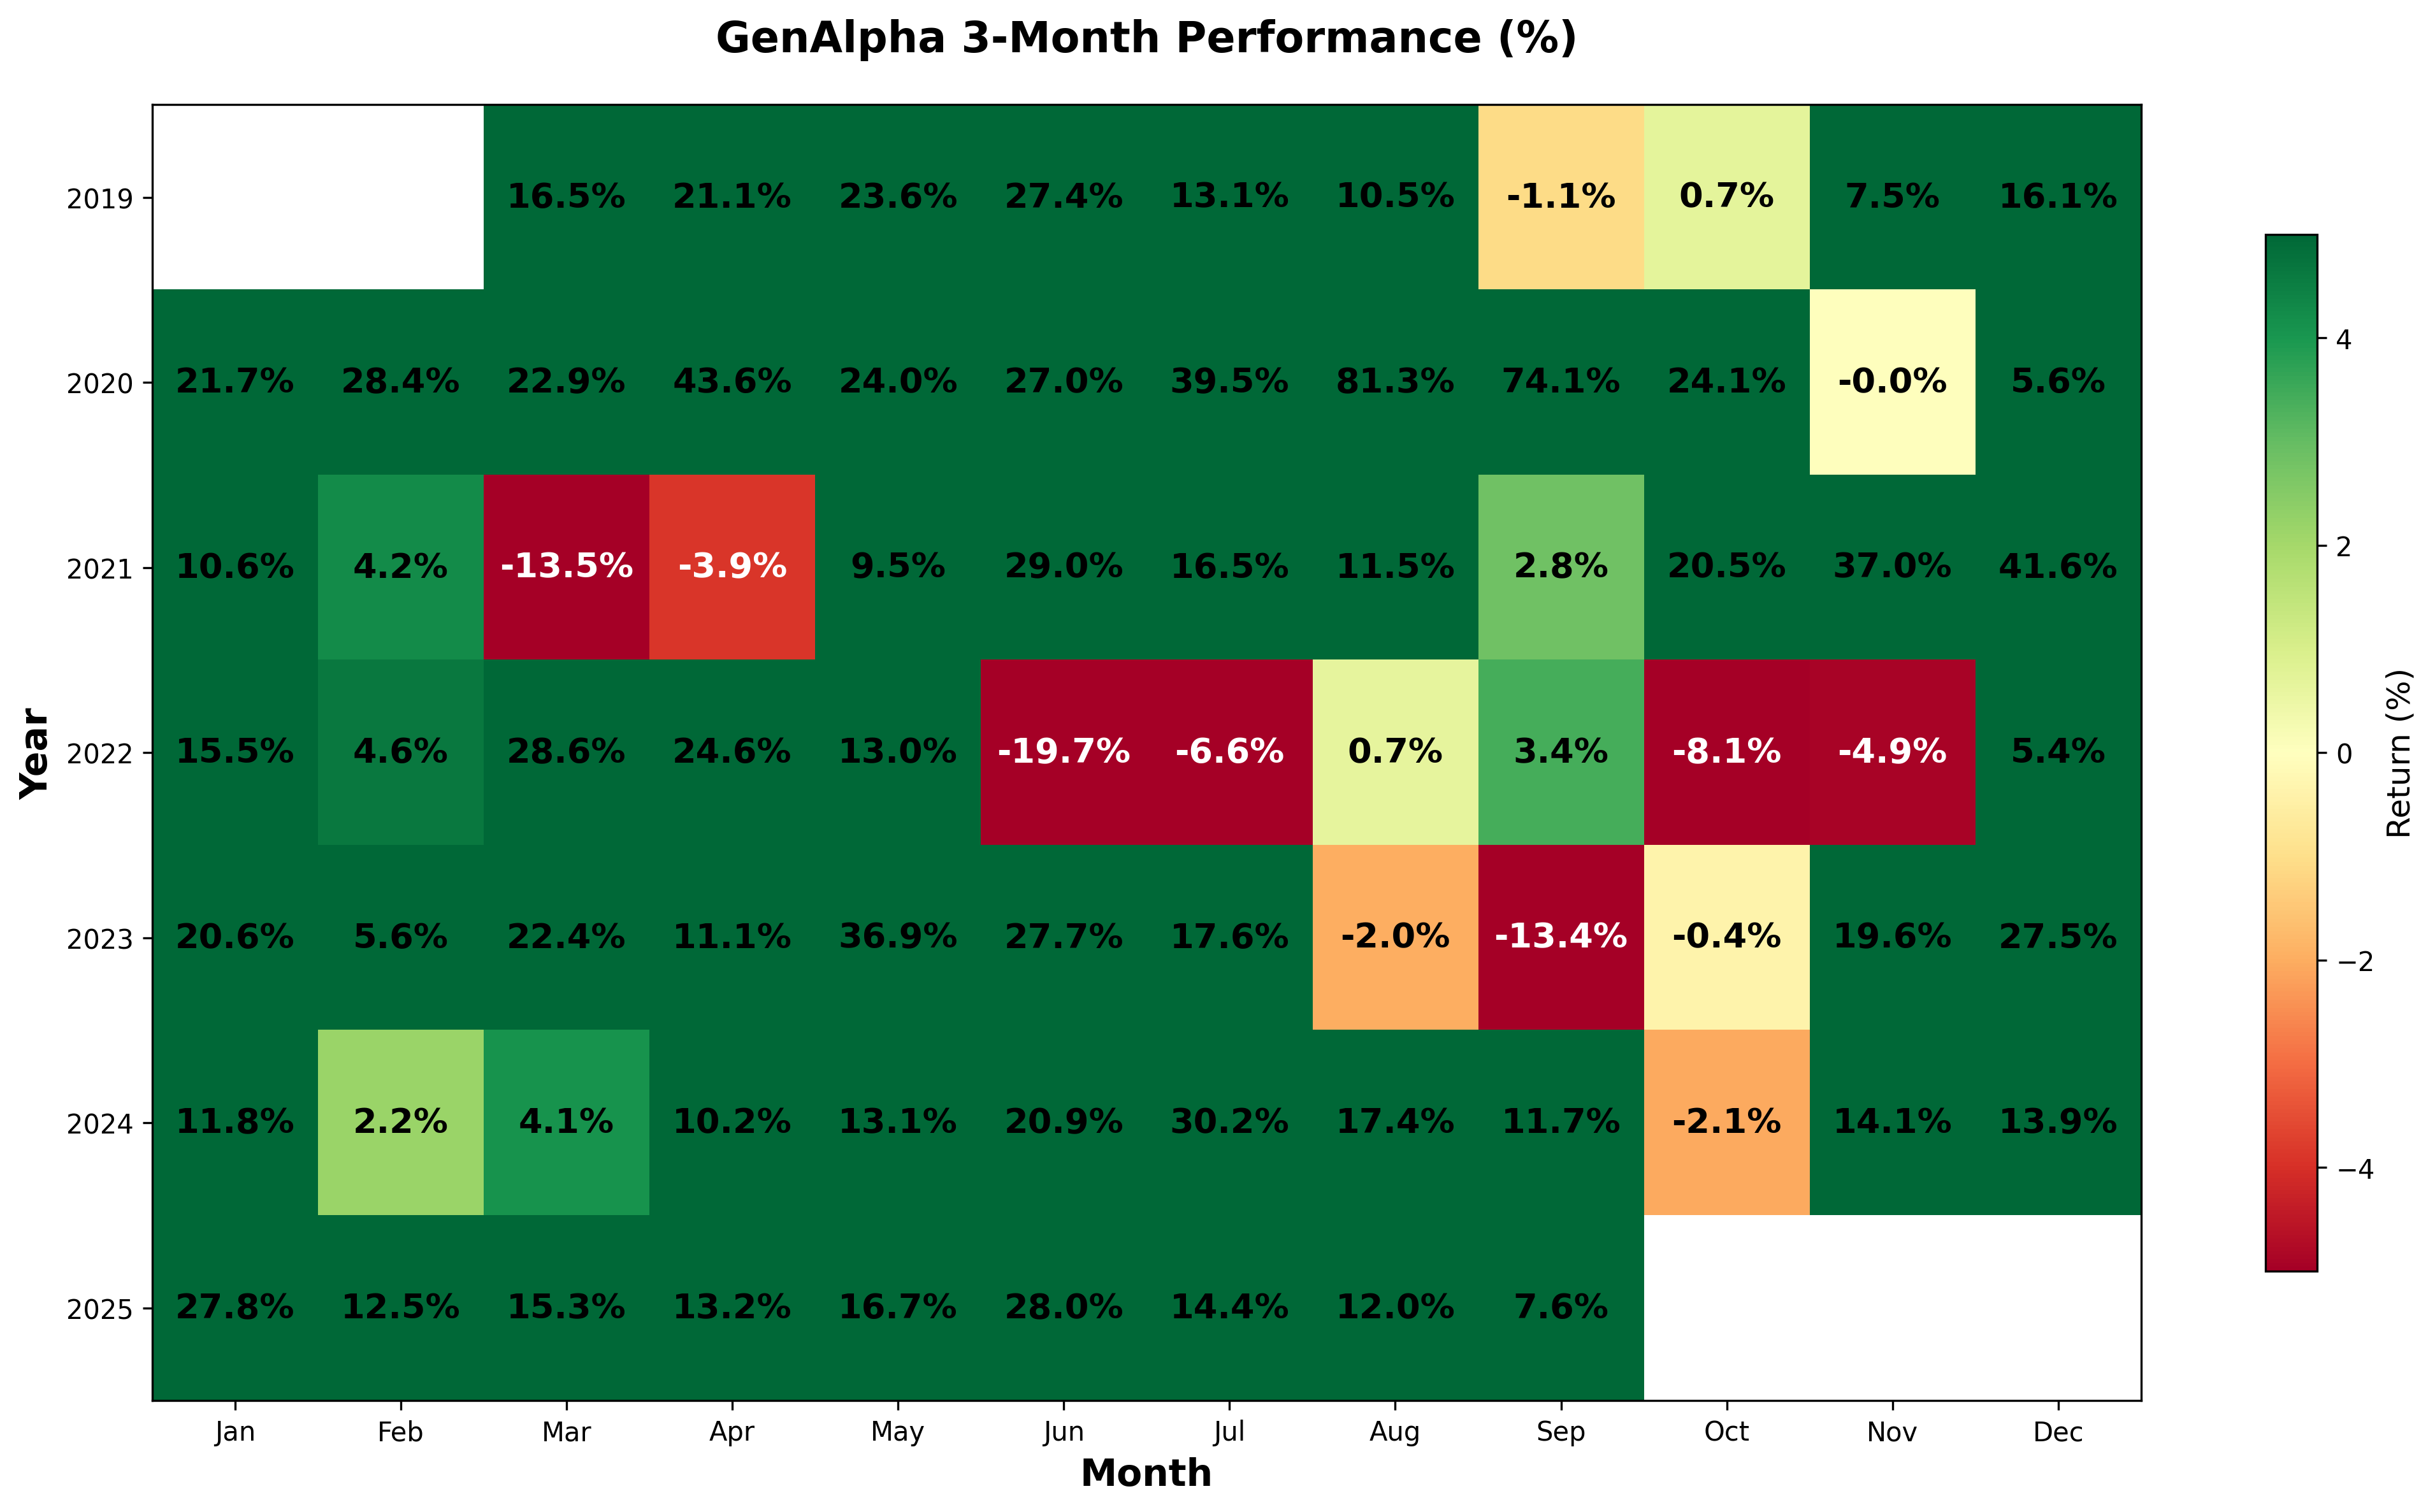
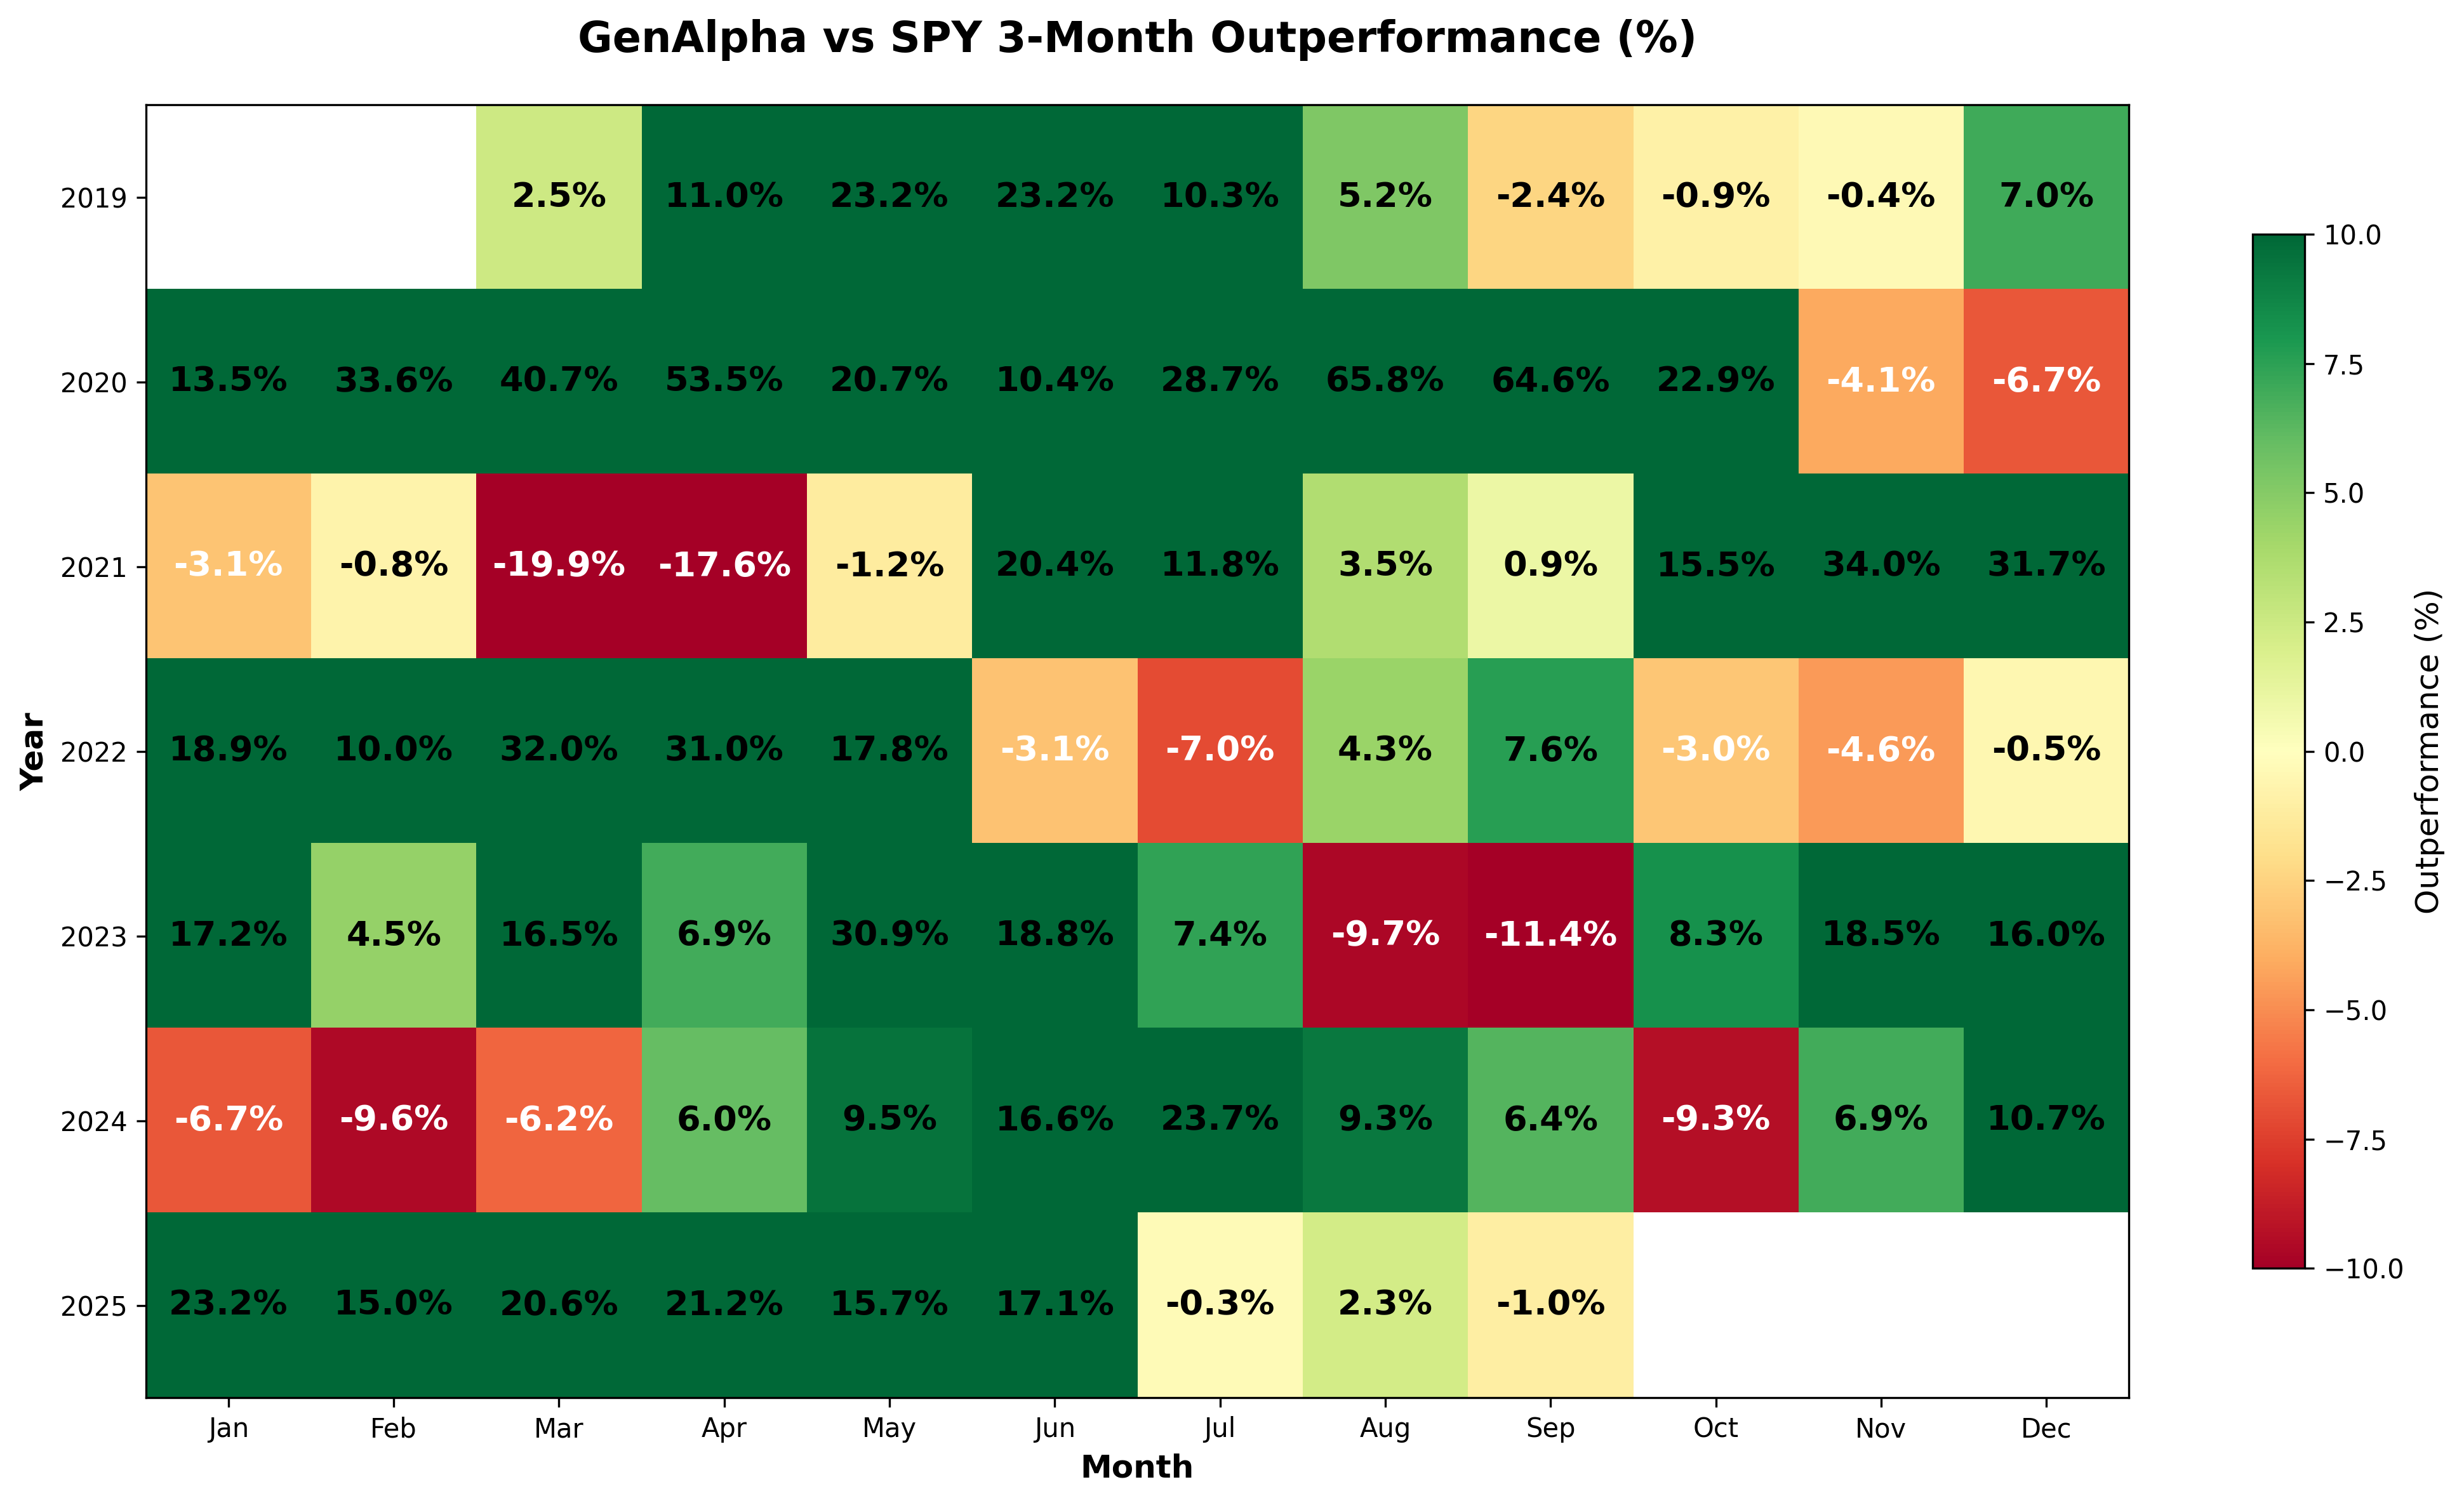
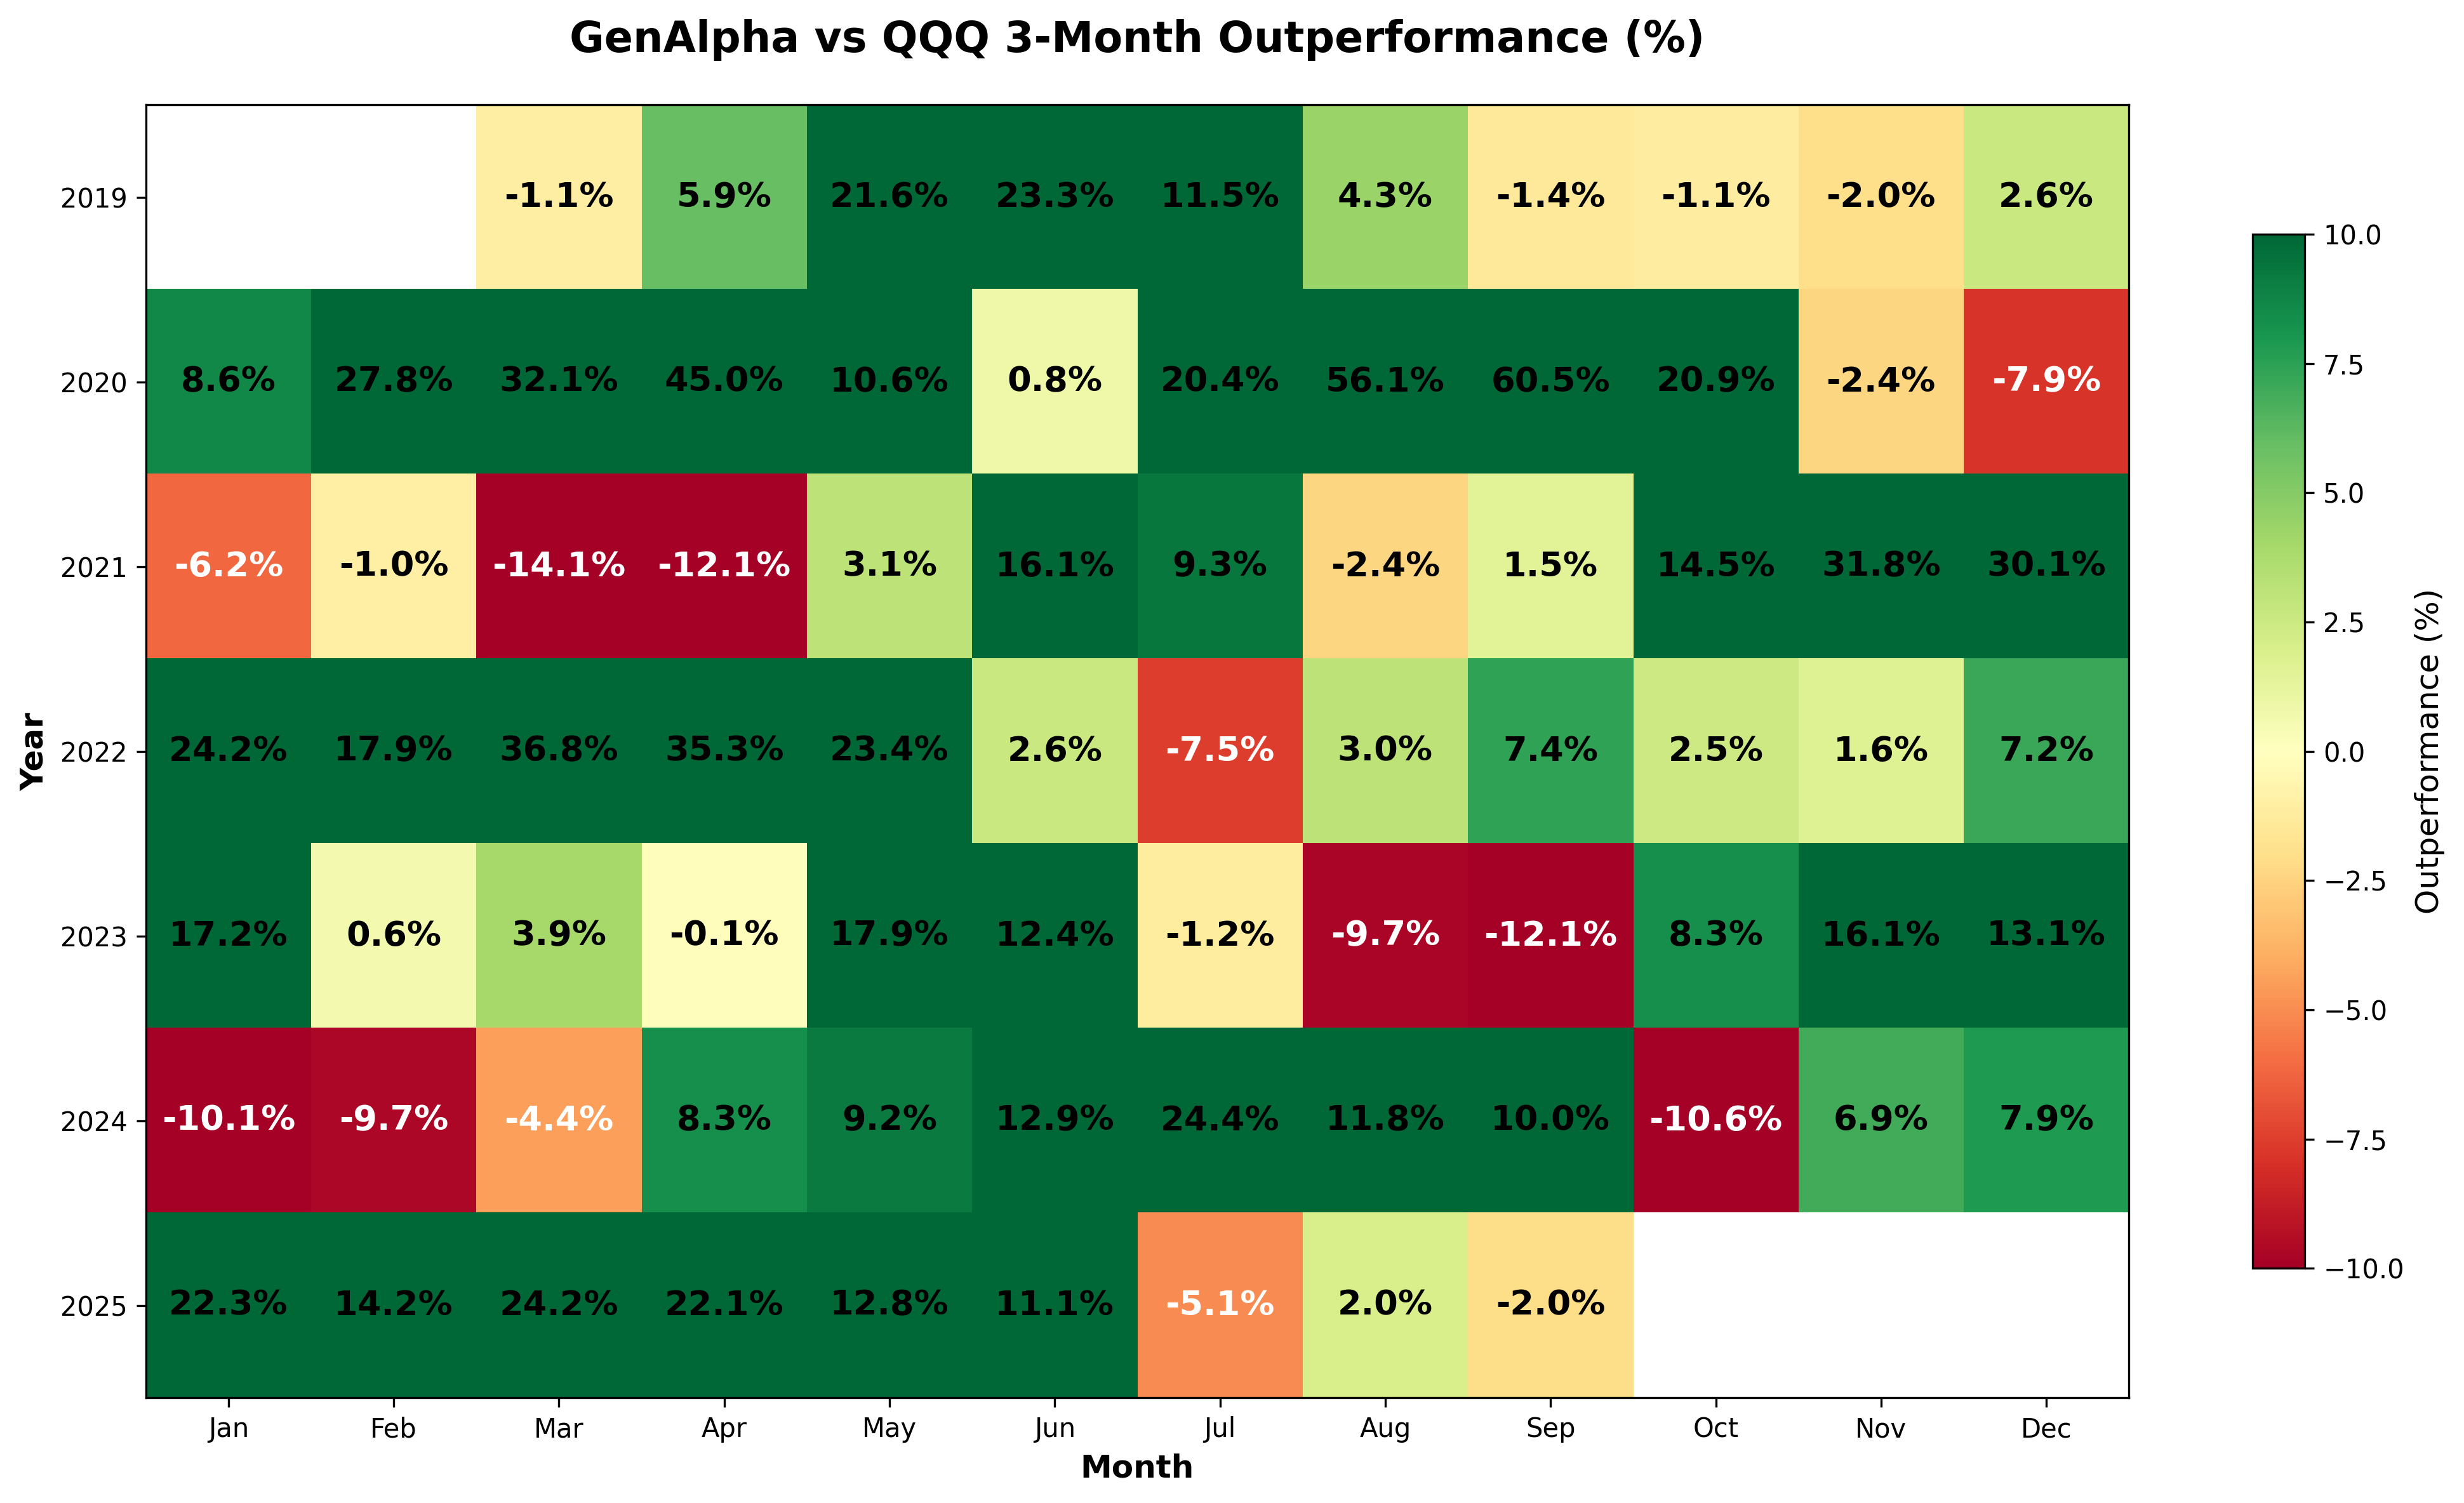
GenAlpha - 3-Month Performance Analysis
Click on the individual image to enlarge
How to Read These Charts: The individual portfolio charts show 3-month returns for each strategy. The comparison charts (GenAlpha vs Other Portfolio) display the difference in percentage returns between GenAlpha and the other portfolio. A positive number indicates GenAlpha performed better, while a negative number indicates the other portfolio performed better.
SPY
QQQ
GenAlpha
GenAlpha vs SPY
GenAlpha vs QQQ
Performance results from January 2019 through December 2025 are based on backtested data. 2026 results through May 31, 2026 reflect actual signals sent to subscribers. Past performance does not guarantee future results.
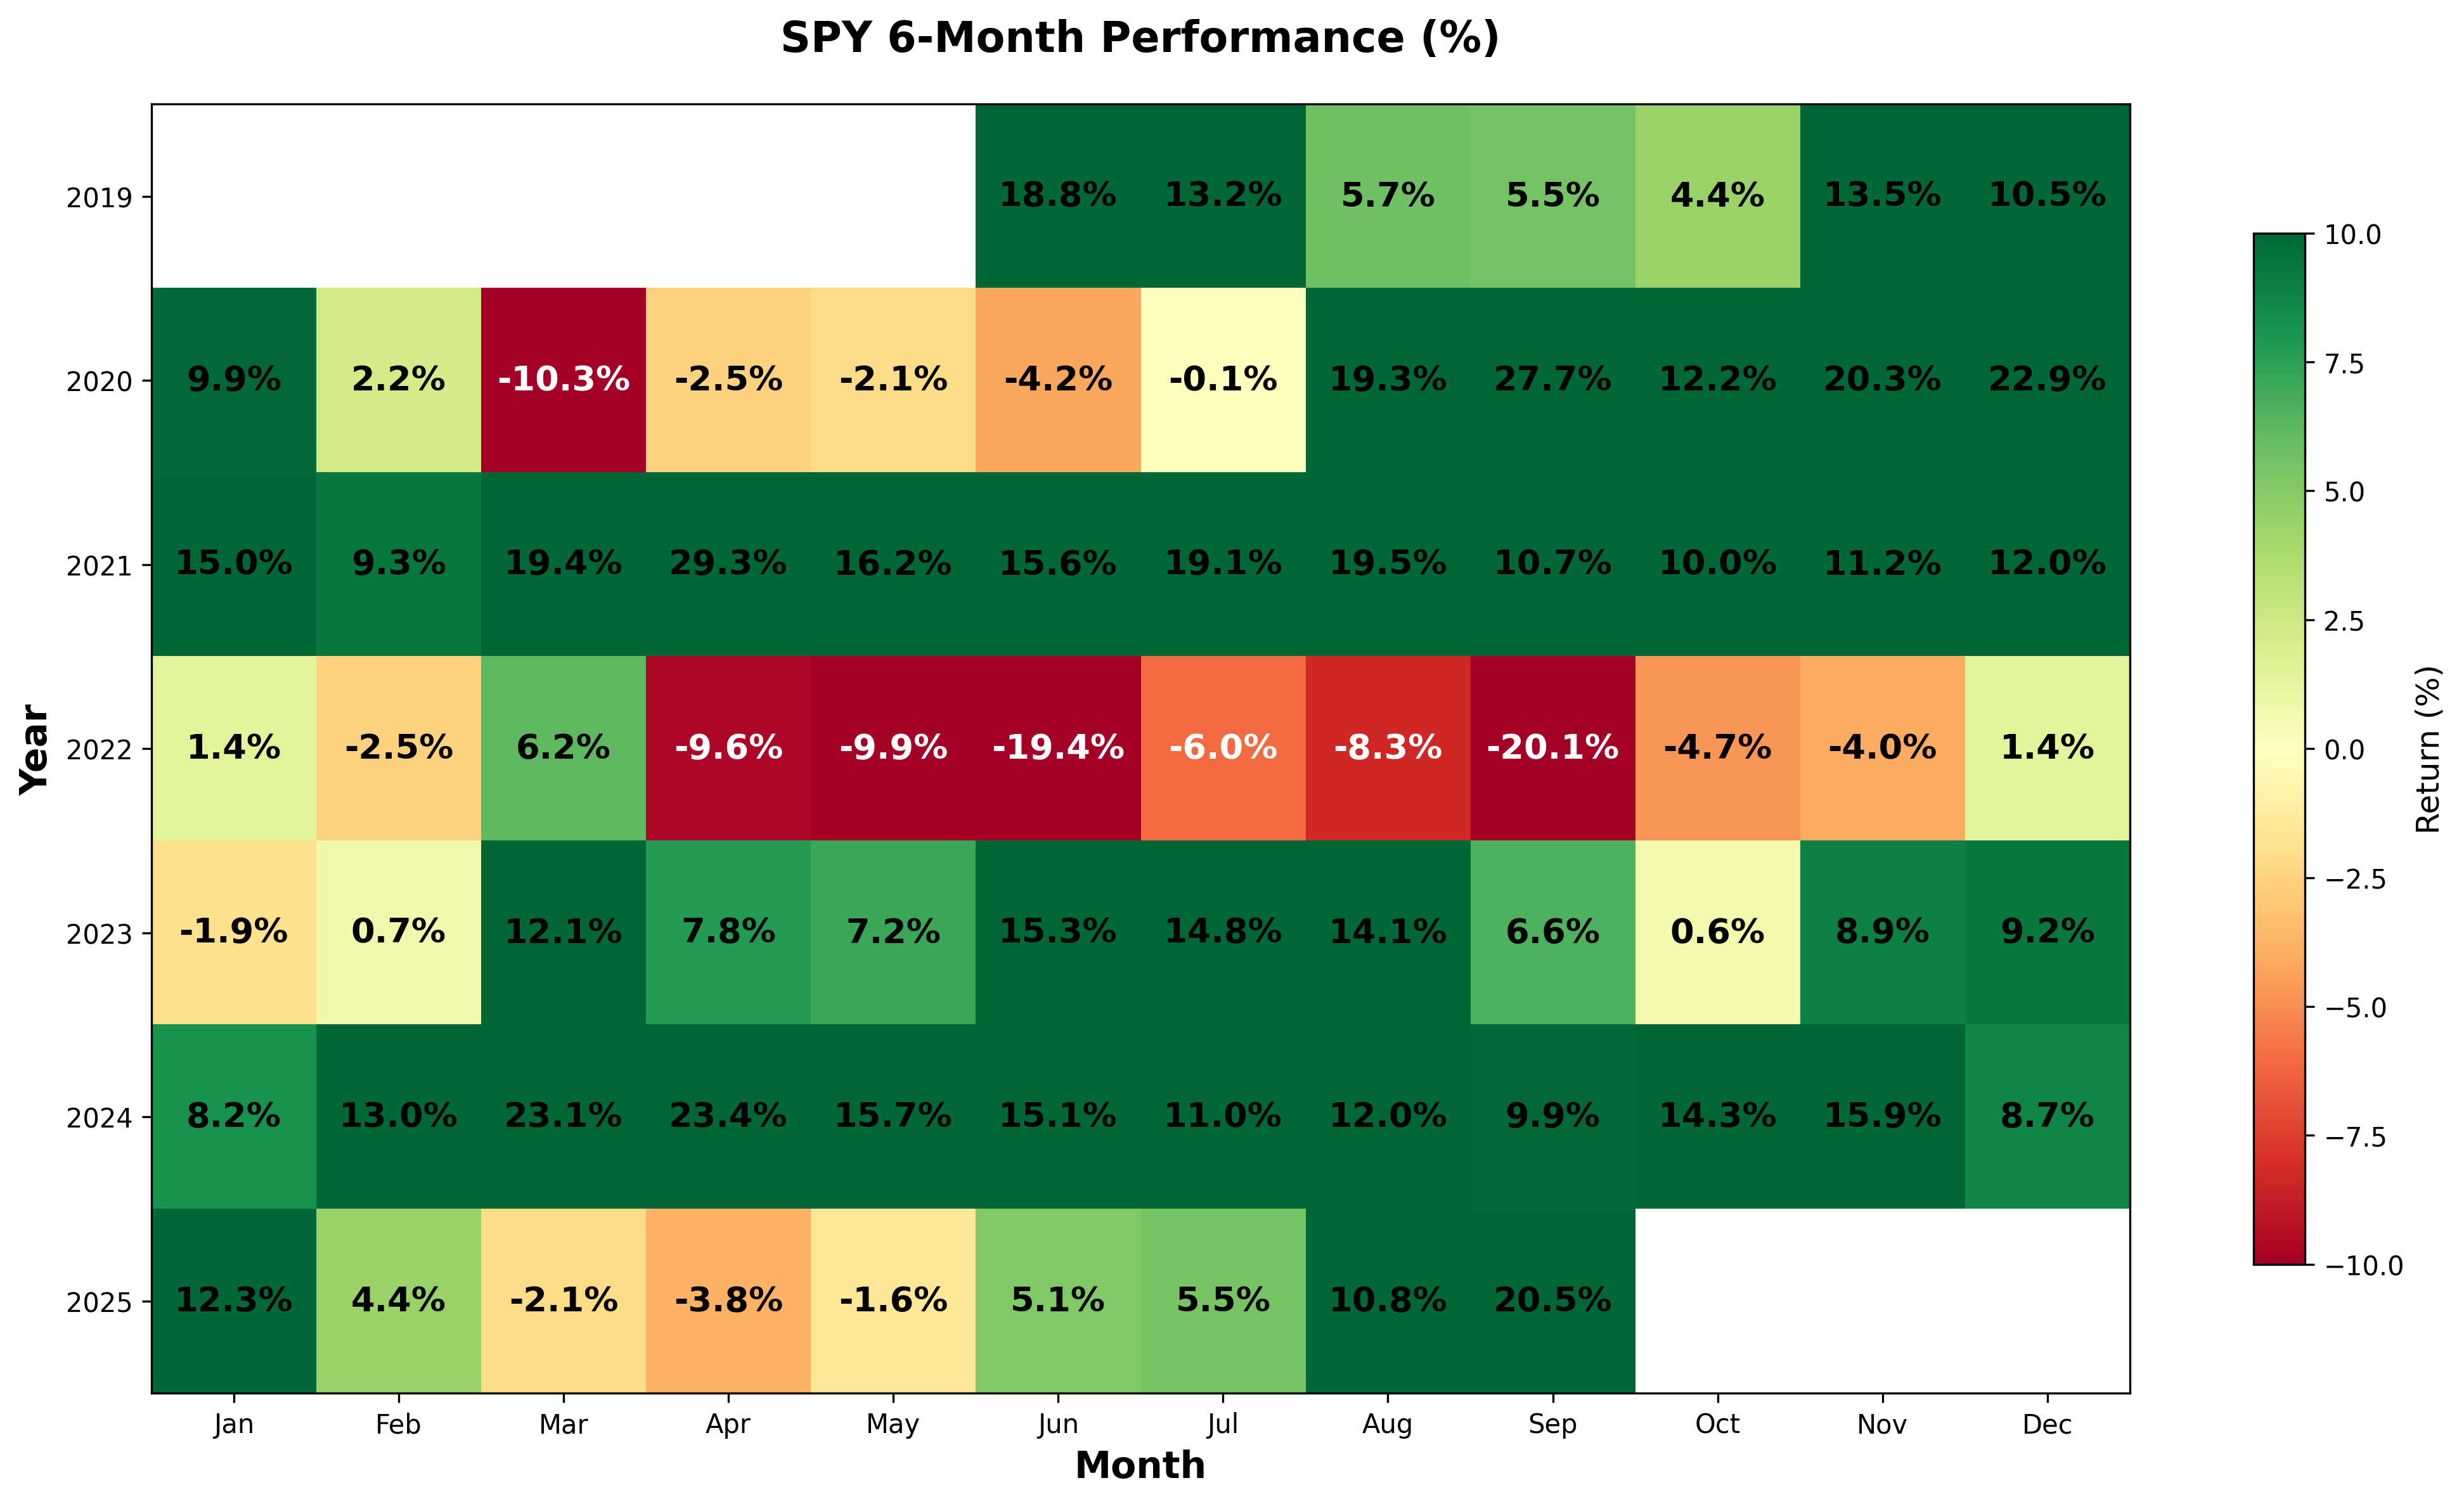
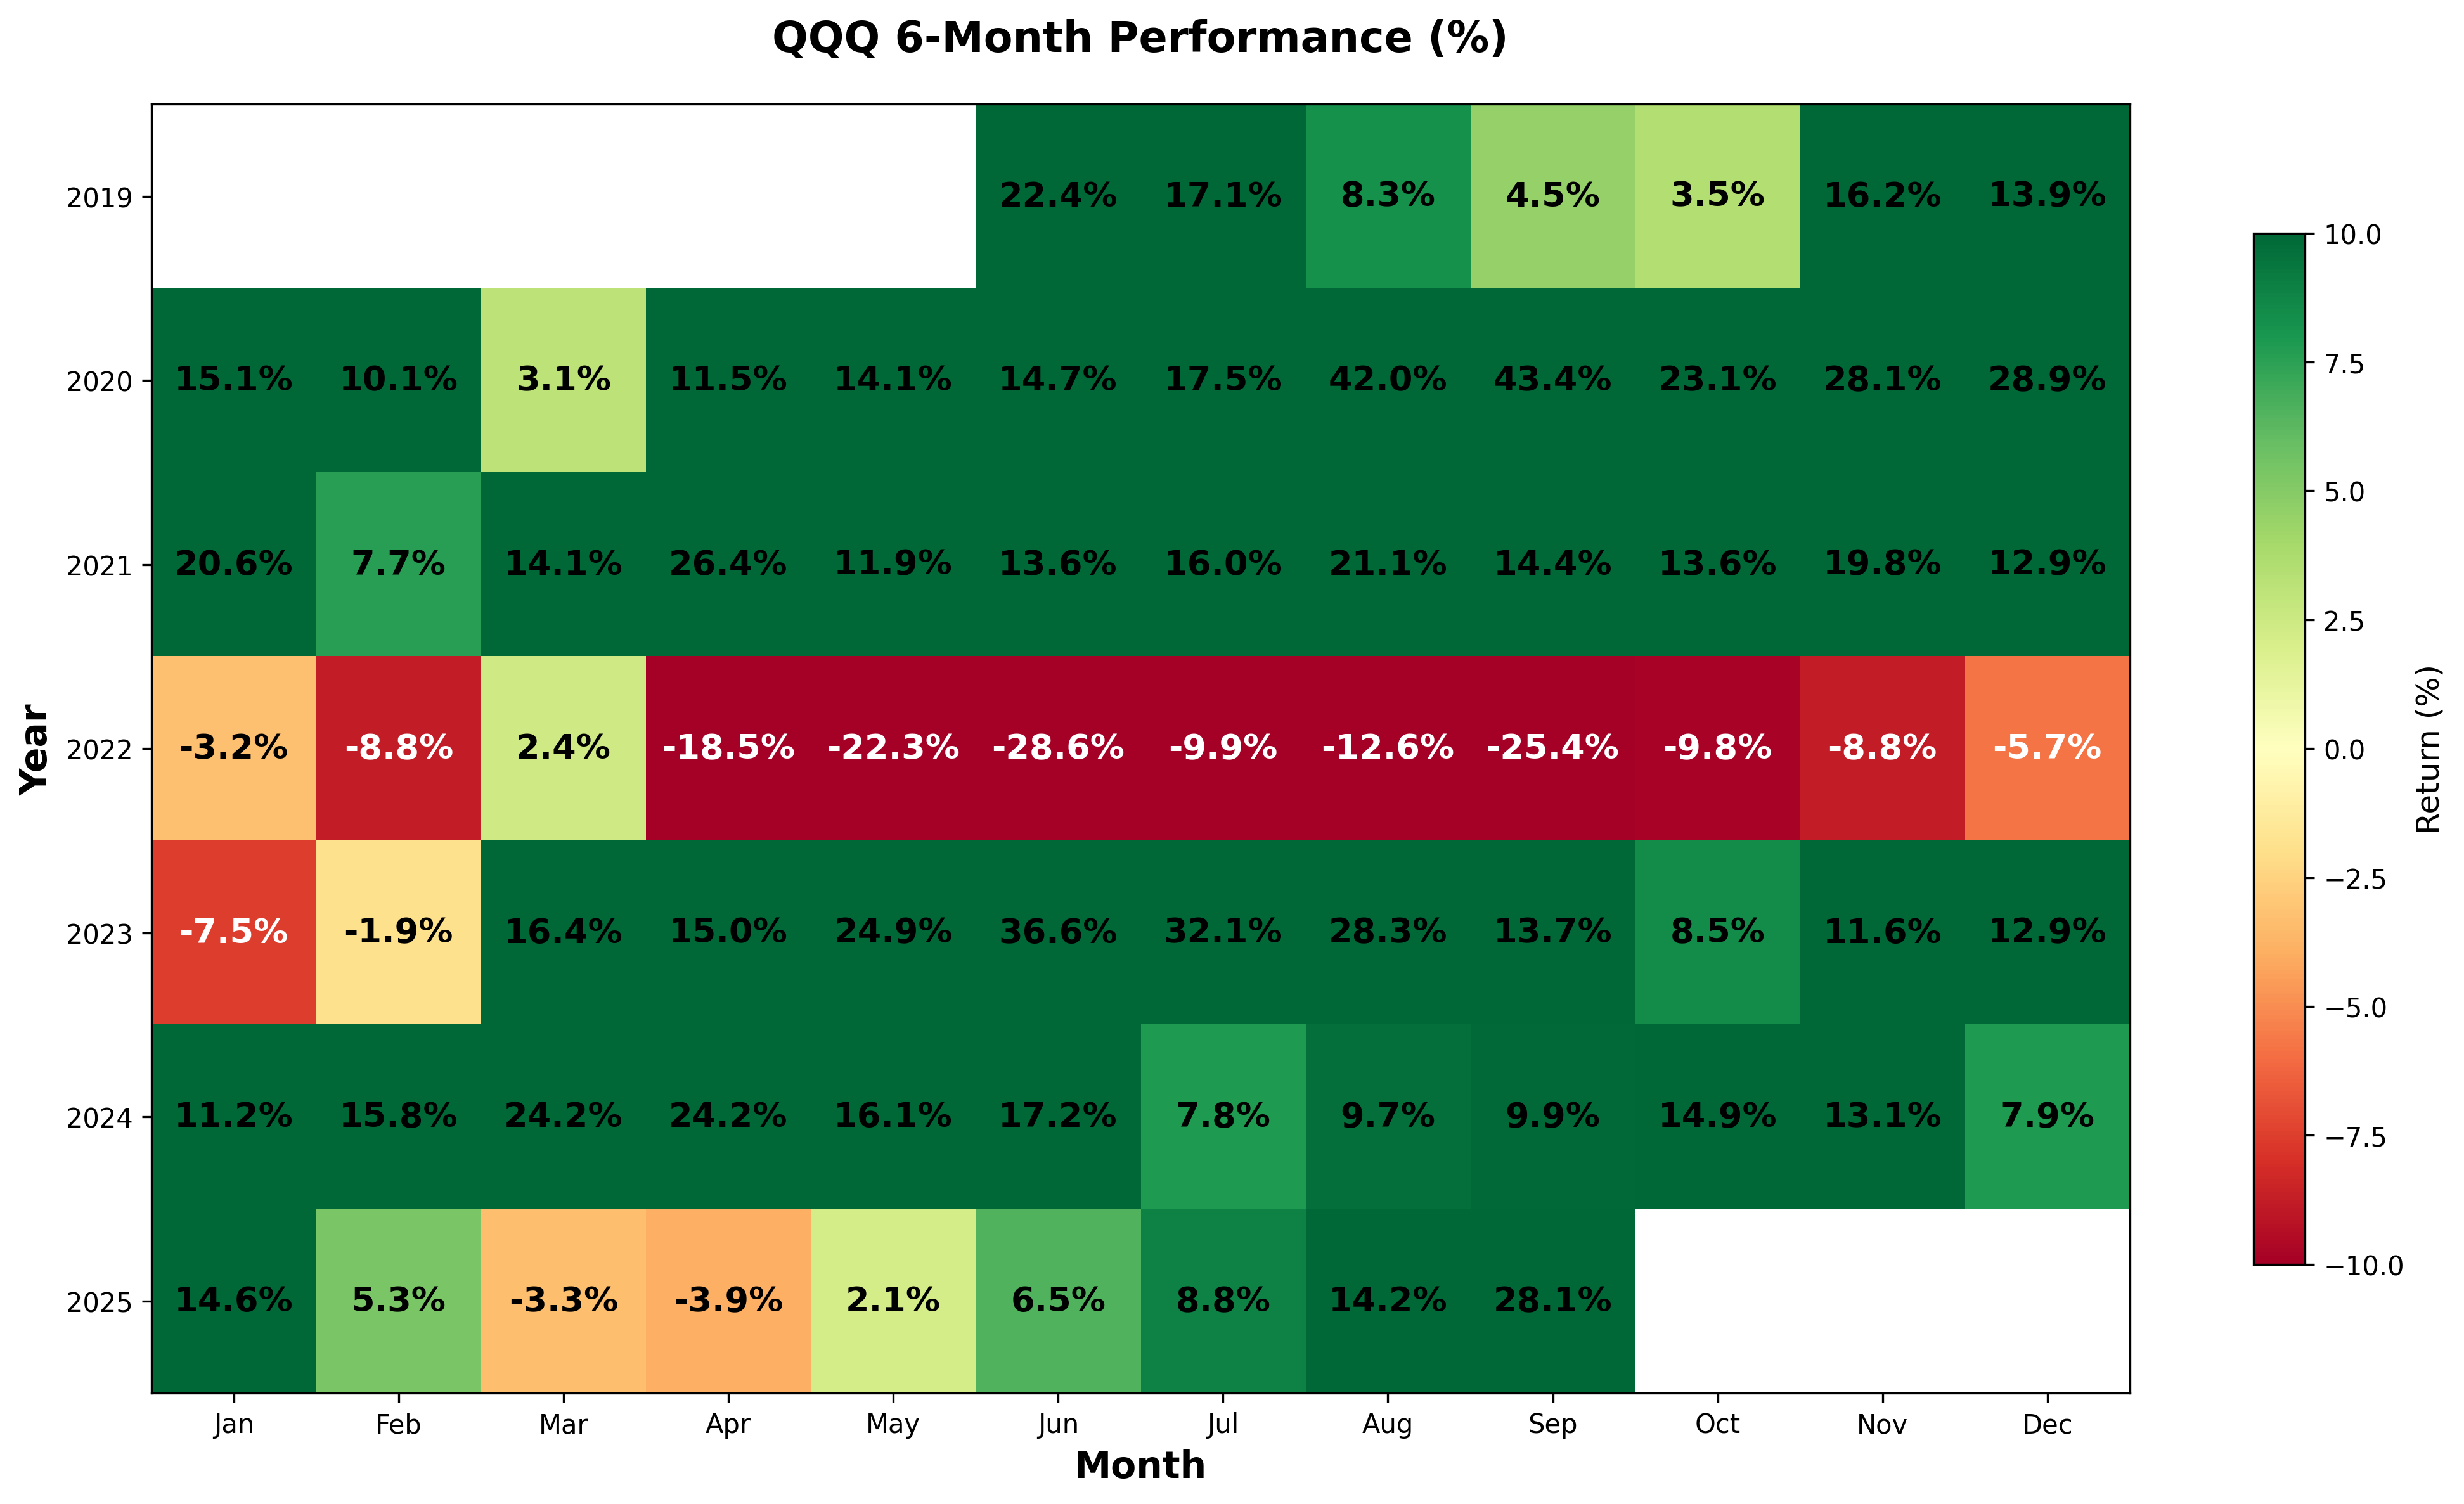
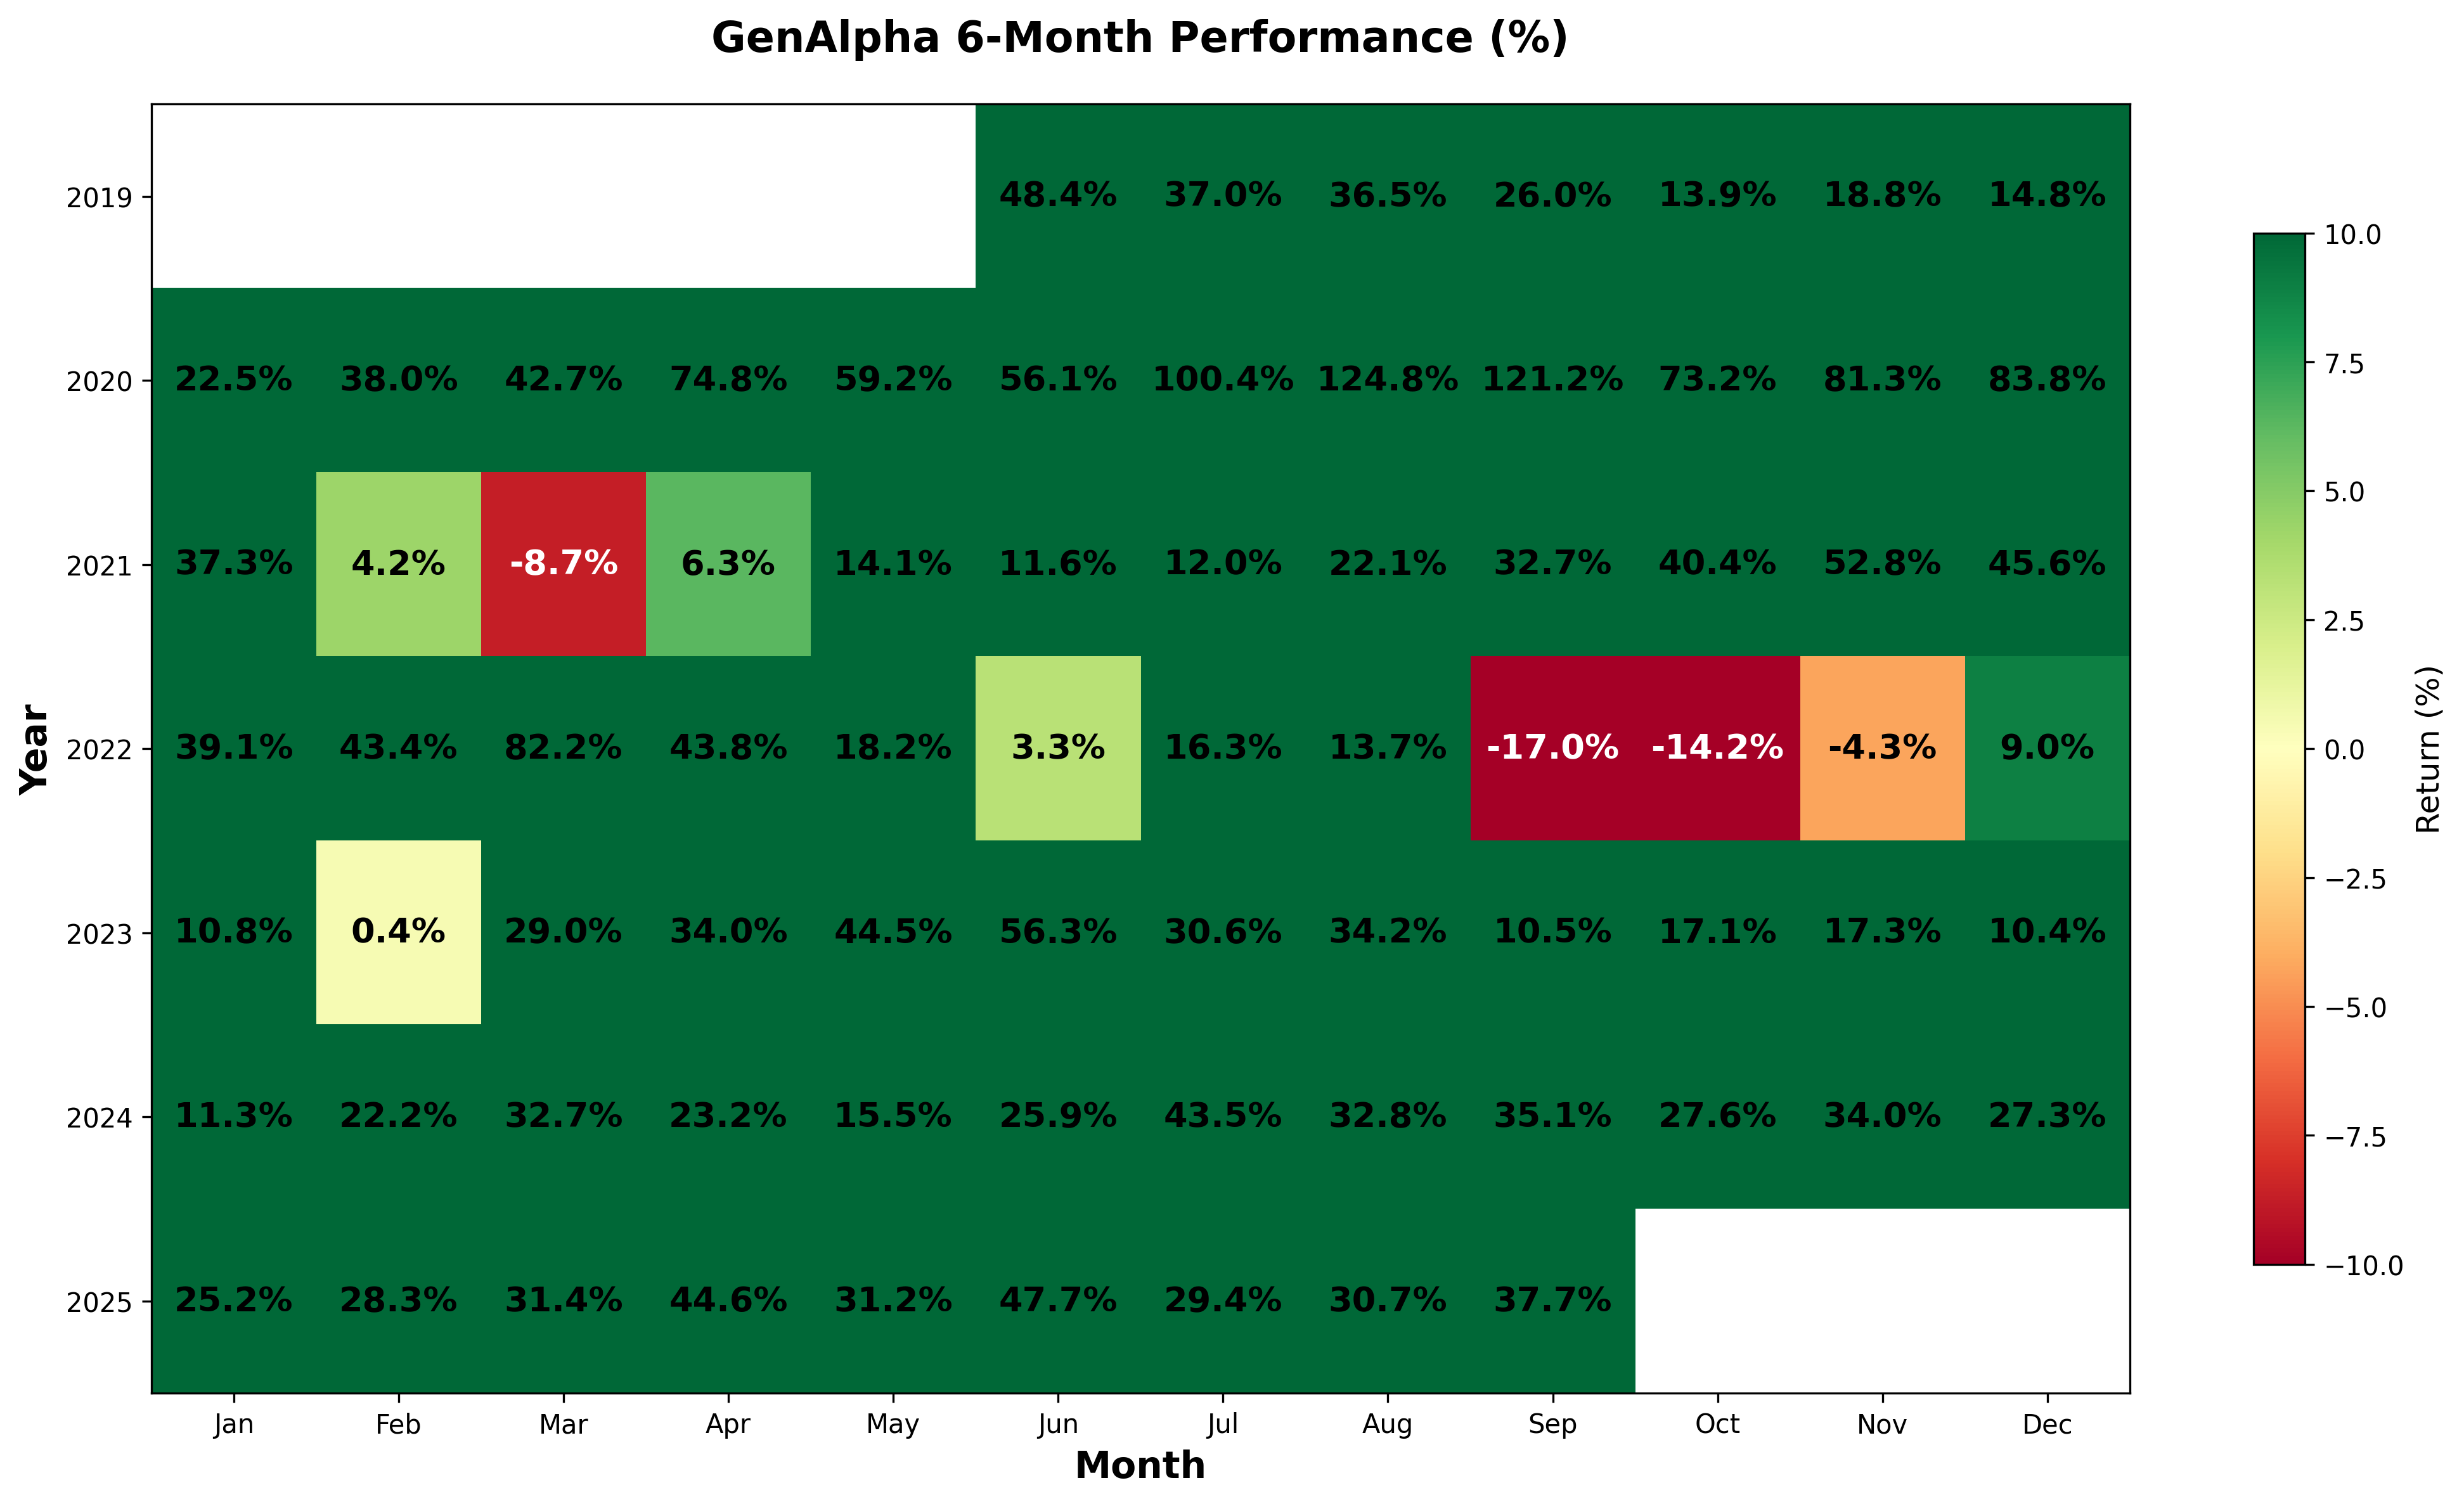
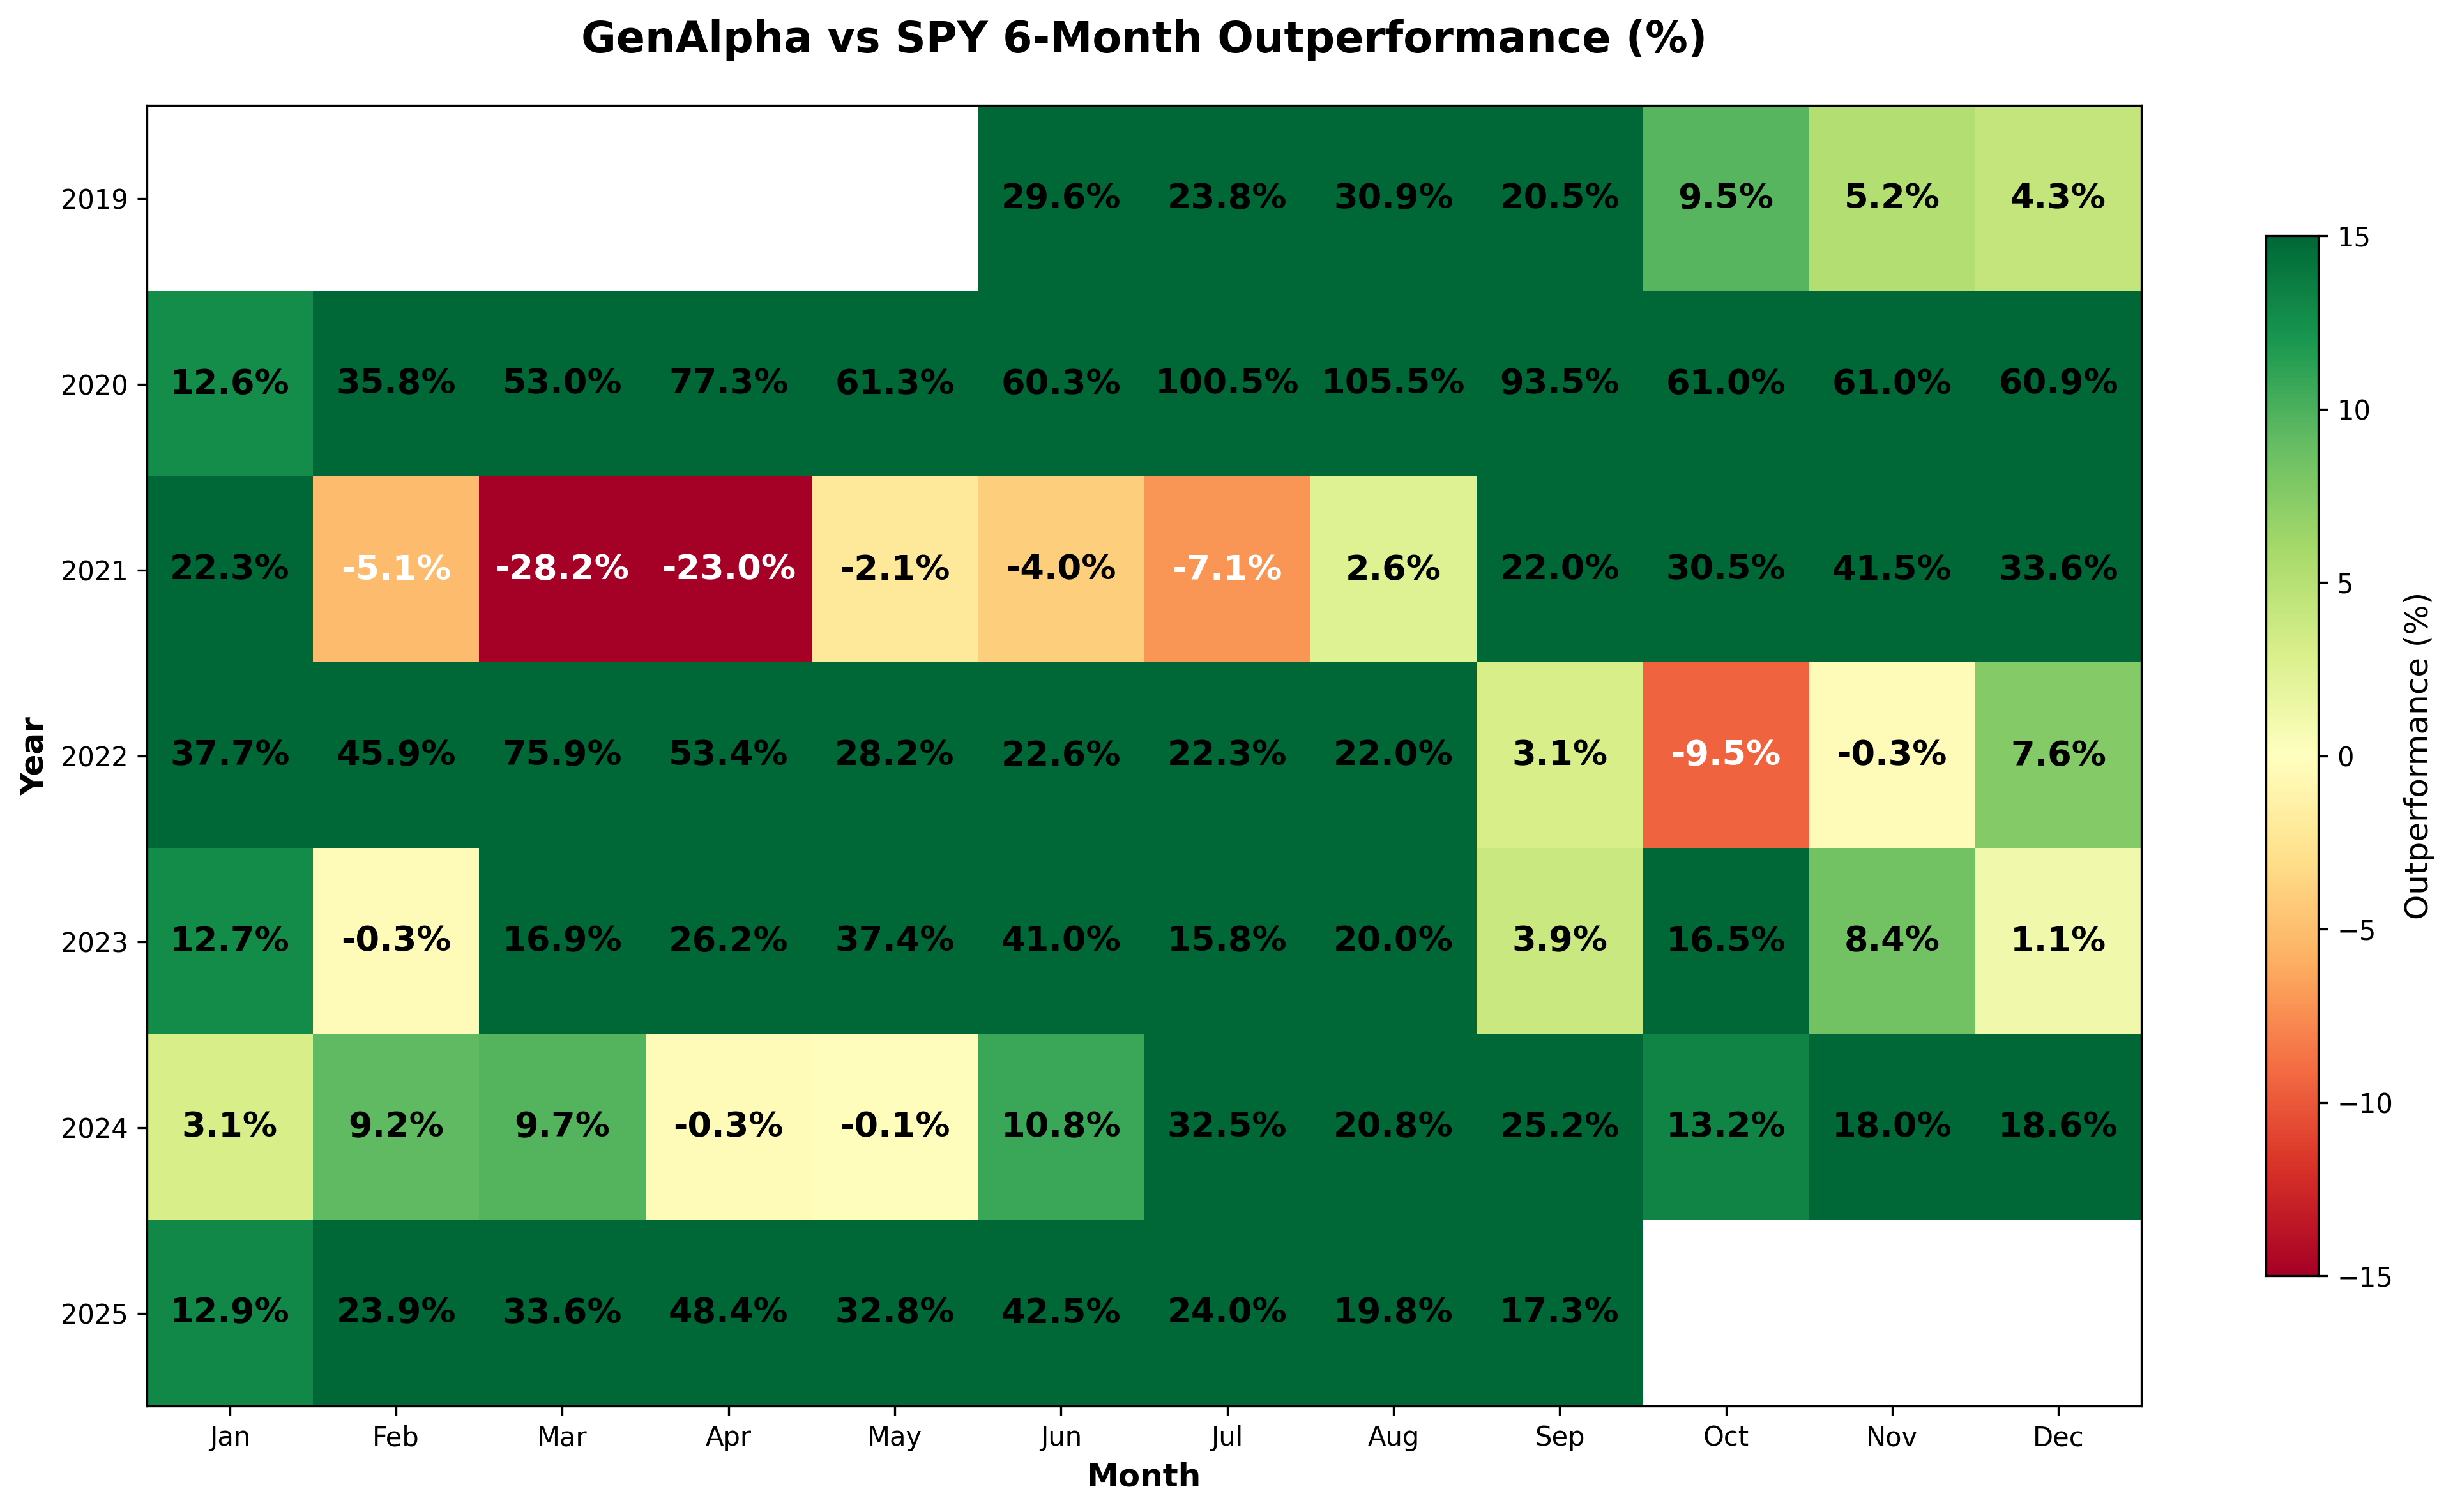
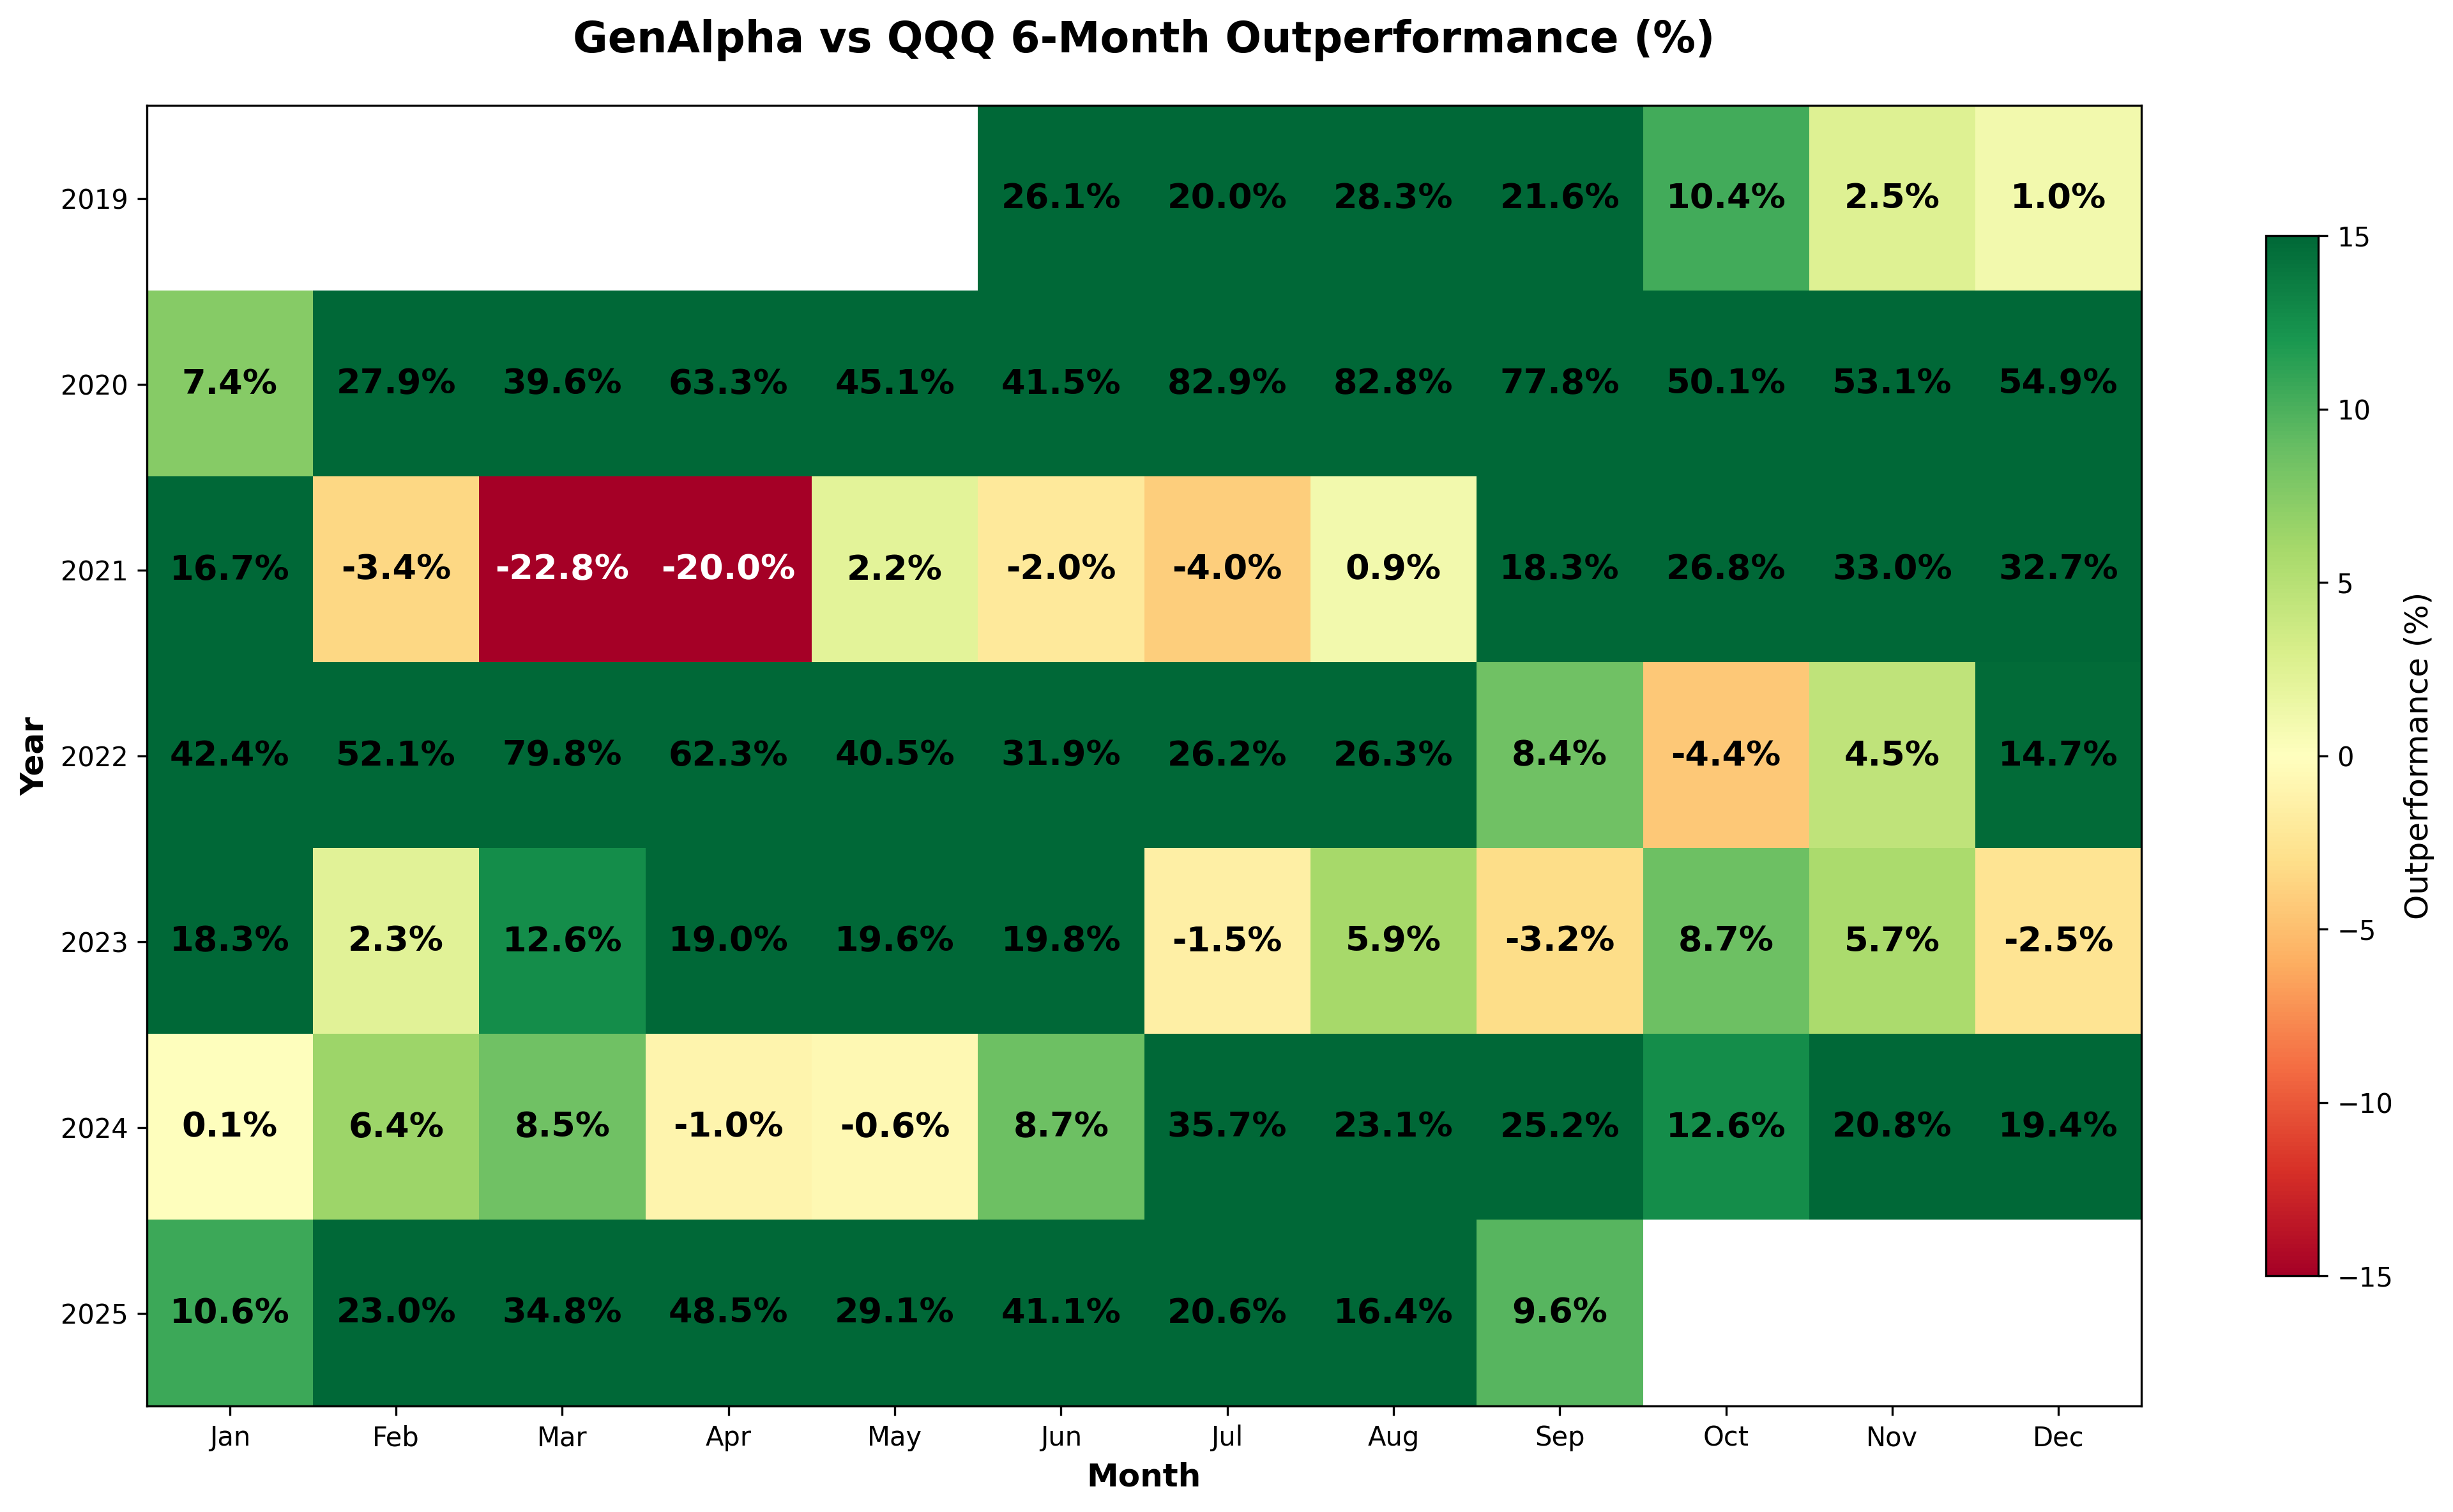
GenAlpha - 6-Month Performance Analysis
Click on the individual image to enlarge
How to Read These Charts: The individual portfolio charts show 6-month returns for each strategy. The comparison charts (GenAlpha vs Other Portfolio) display the difference in percentage returns between GenAlpha and the other portfolio. A positive number indicates GenAlpha performed better, while a negative number indicates the other portfolio performed better.
SPY
QQQ
GenAlpha
GenAlpha vs SPY
GenAlpha vs QQQ
Performance results from January 2019 through December 2025 are based on backtested data. 2026 results through May 31, 2026 reflect actual signals sent to subscribers. Past performance does not guarantee future results.
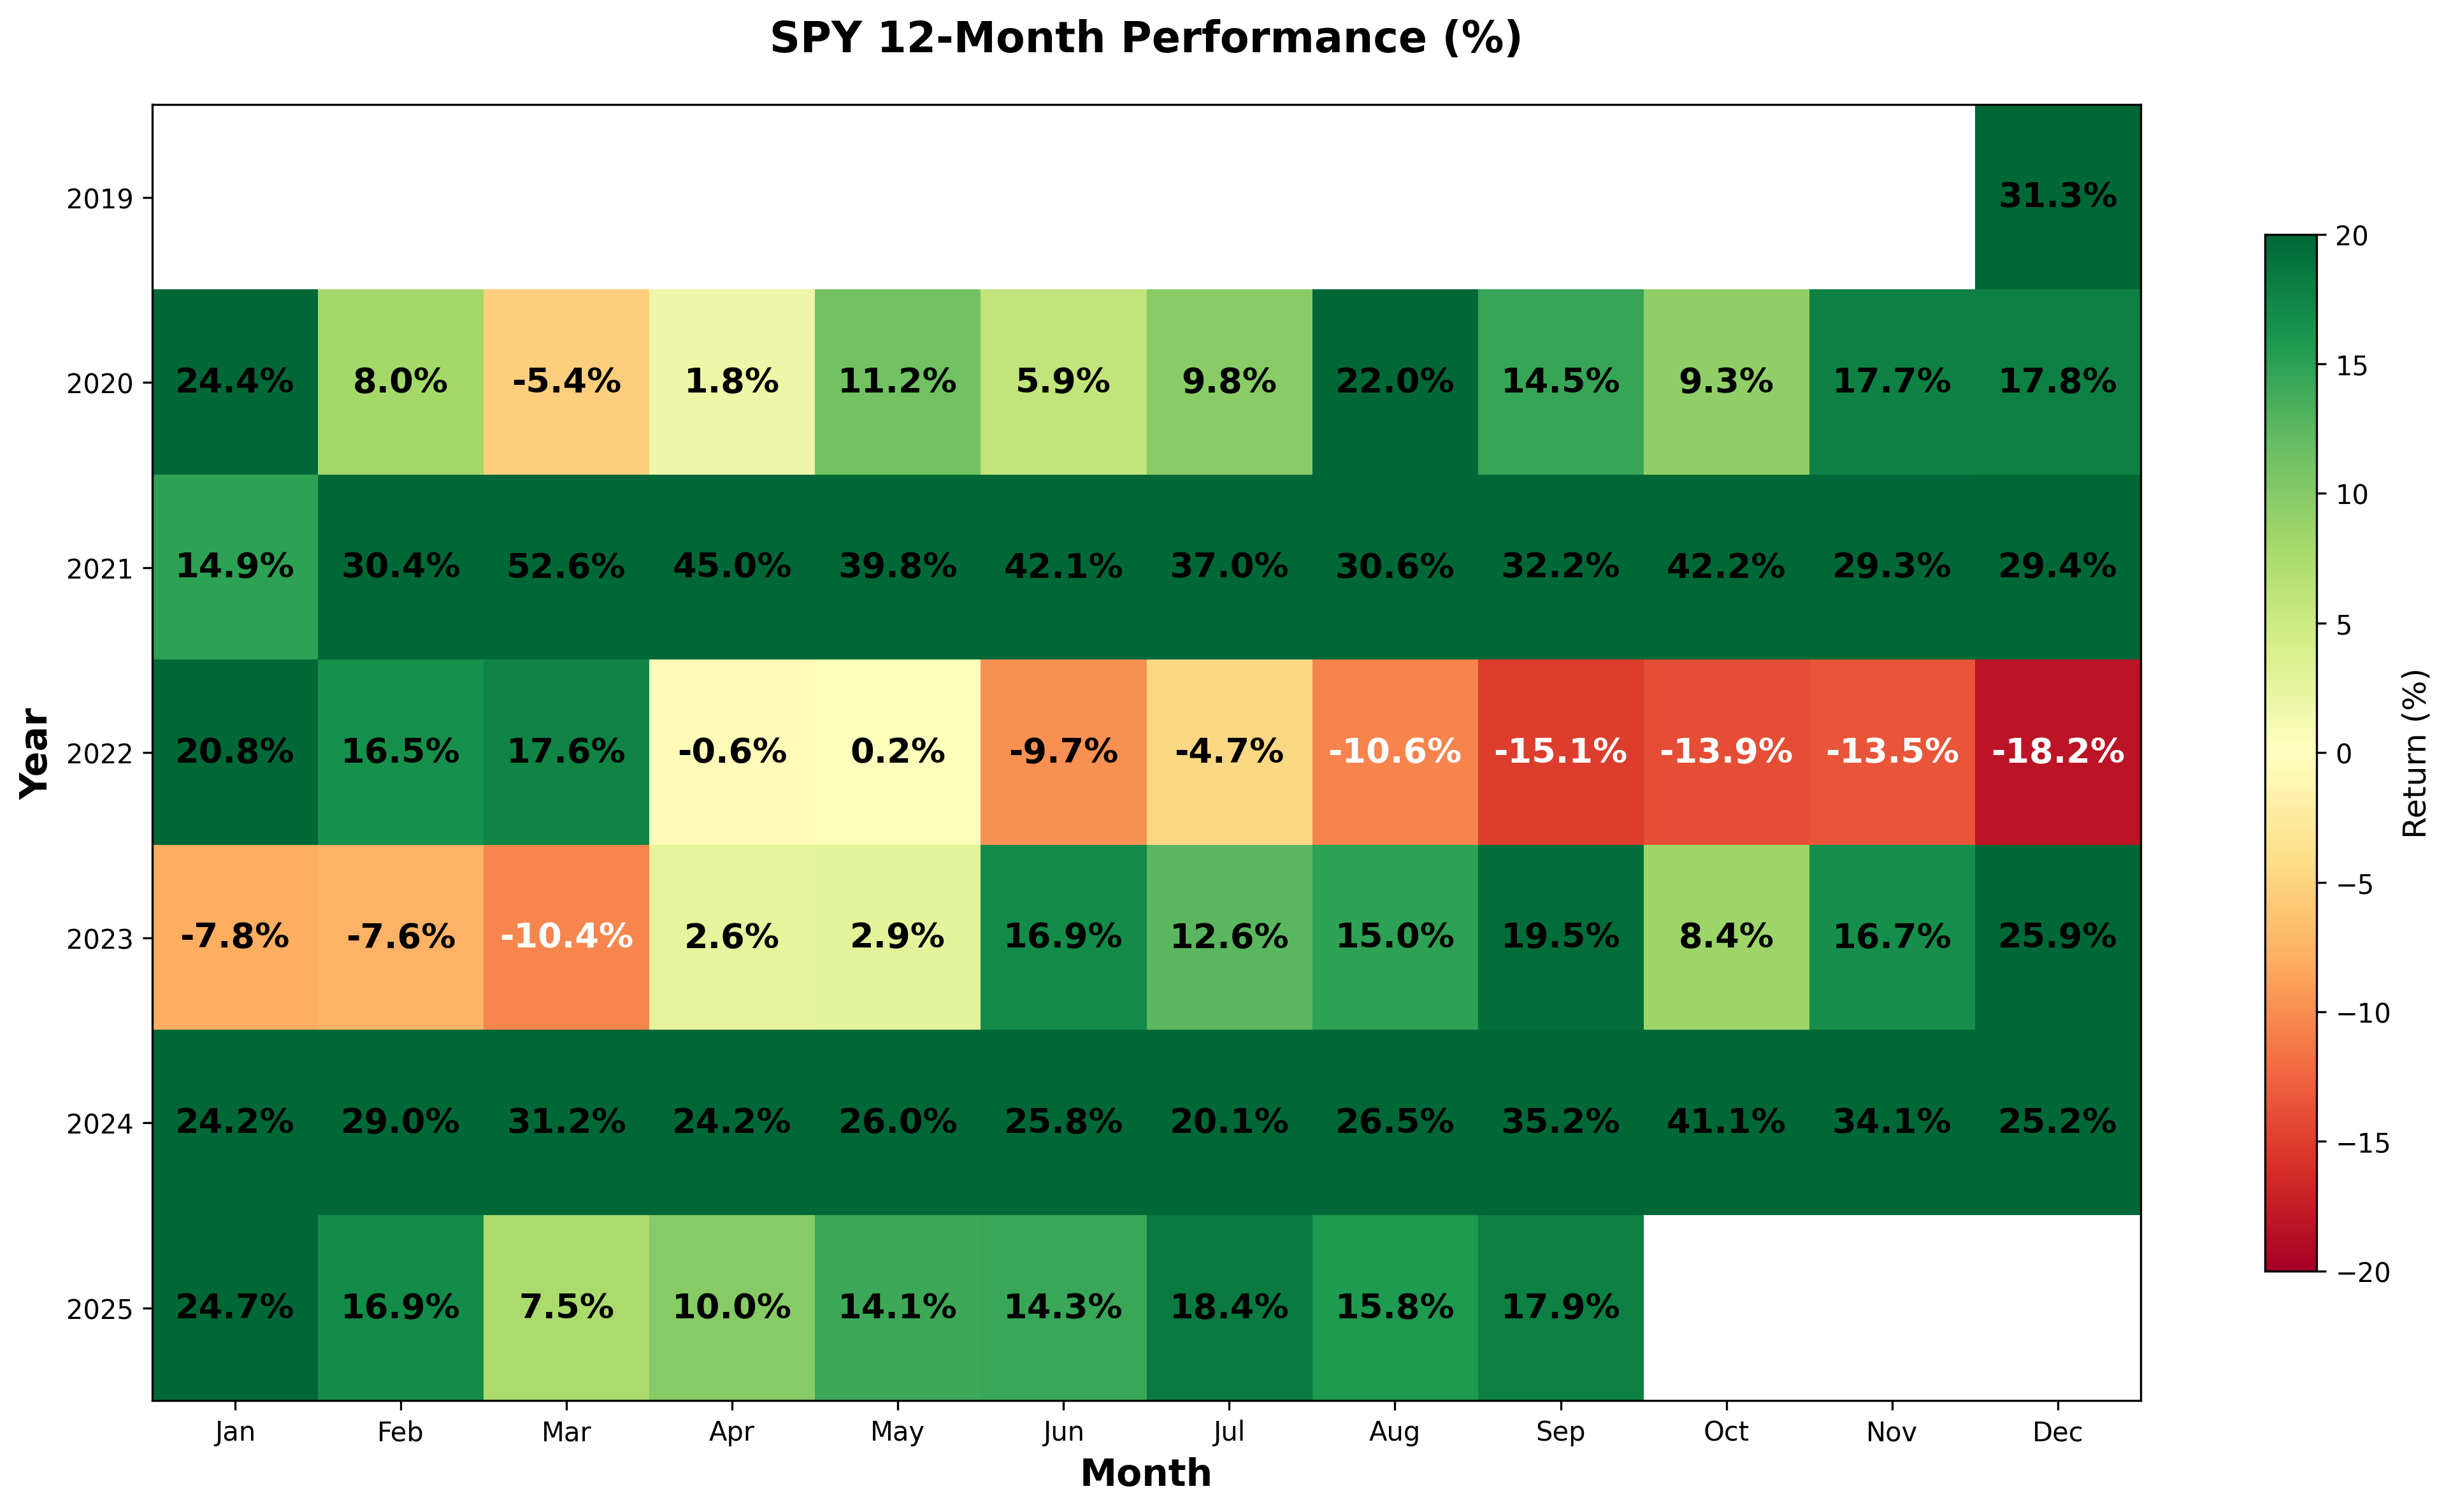
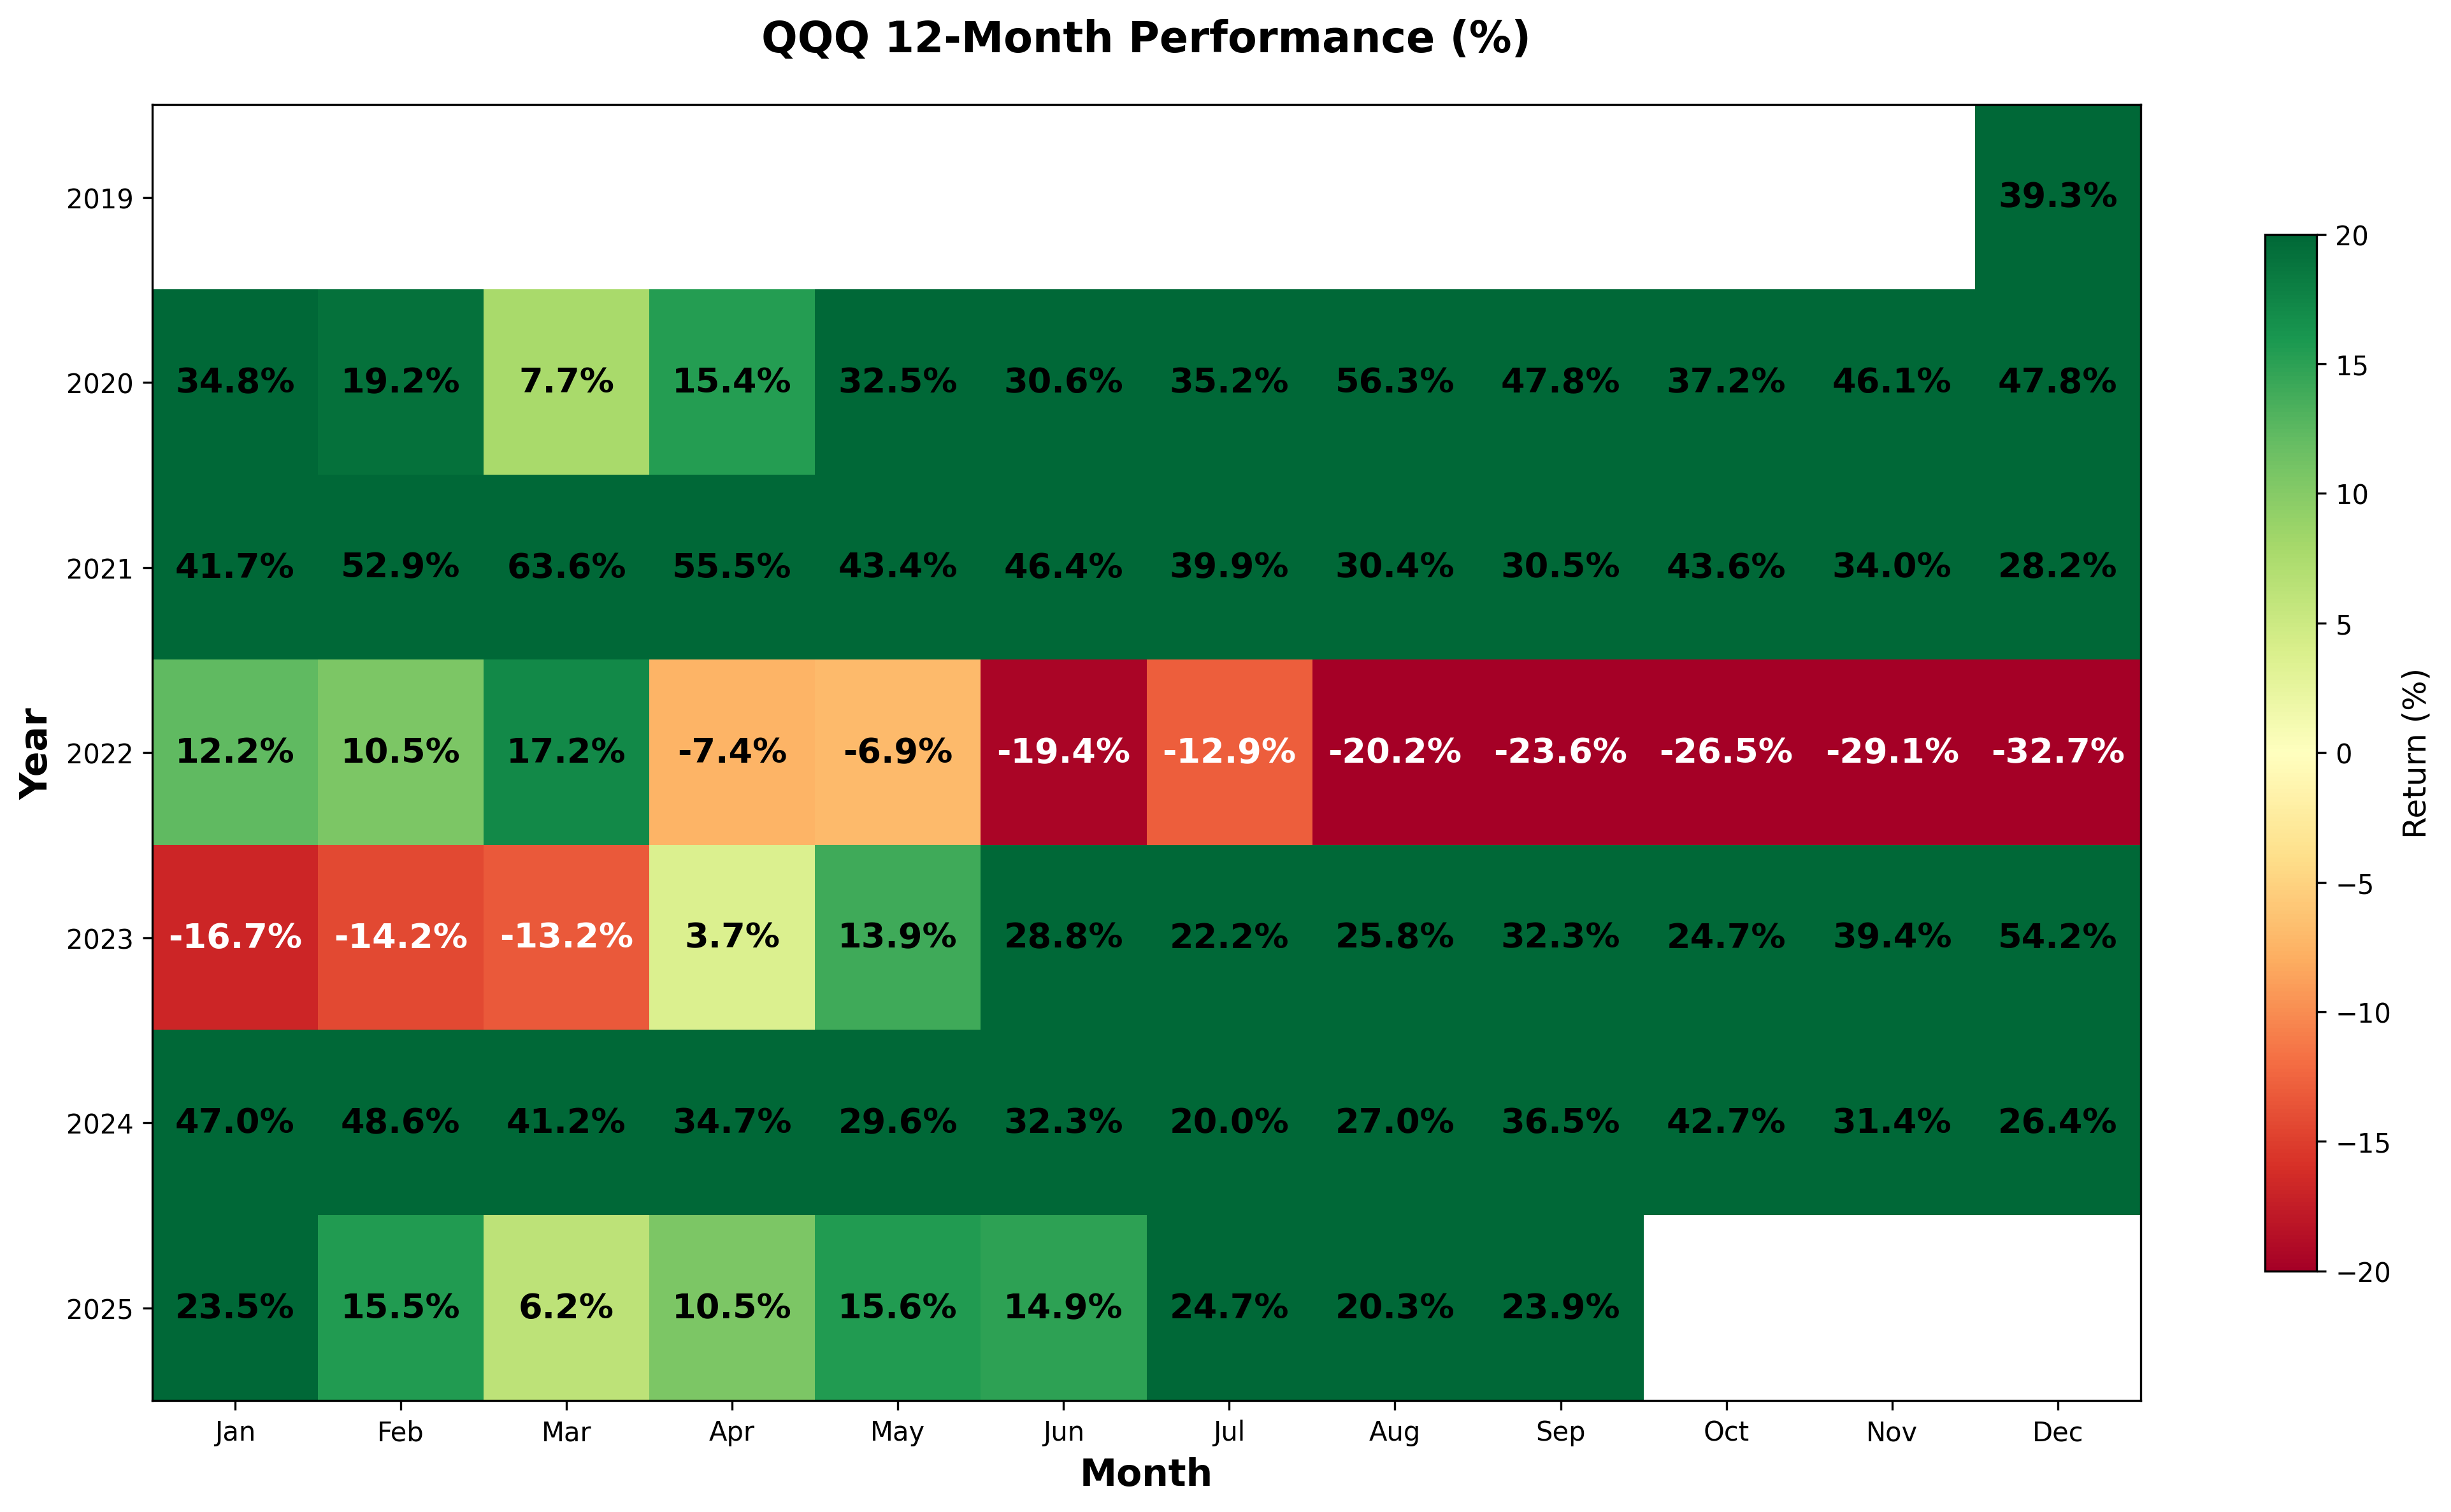
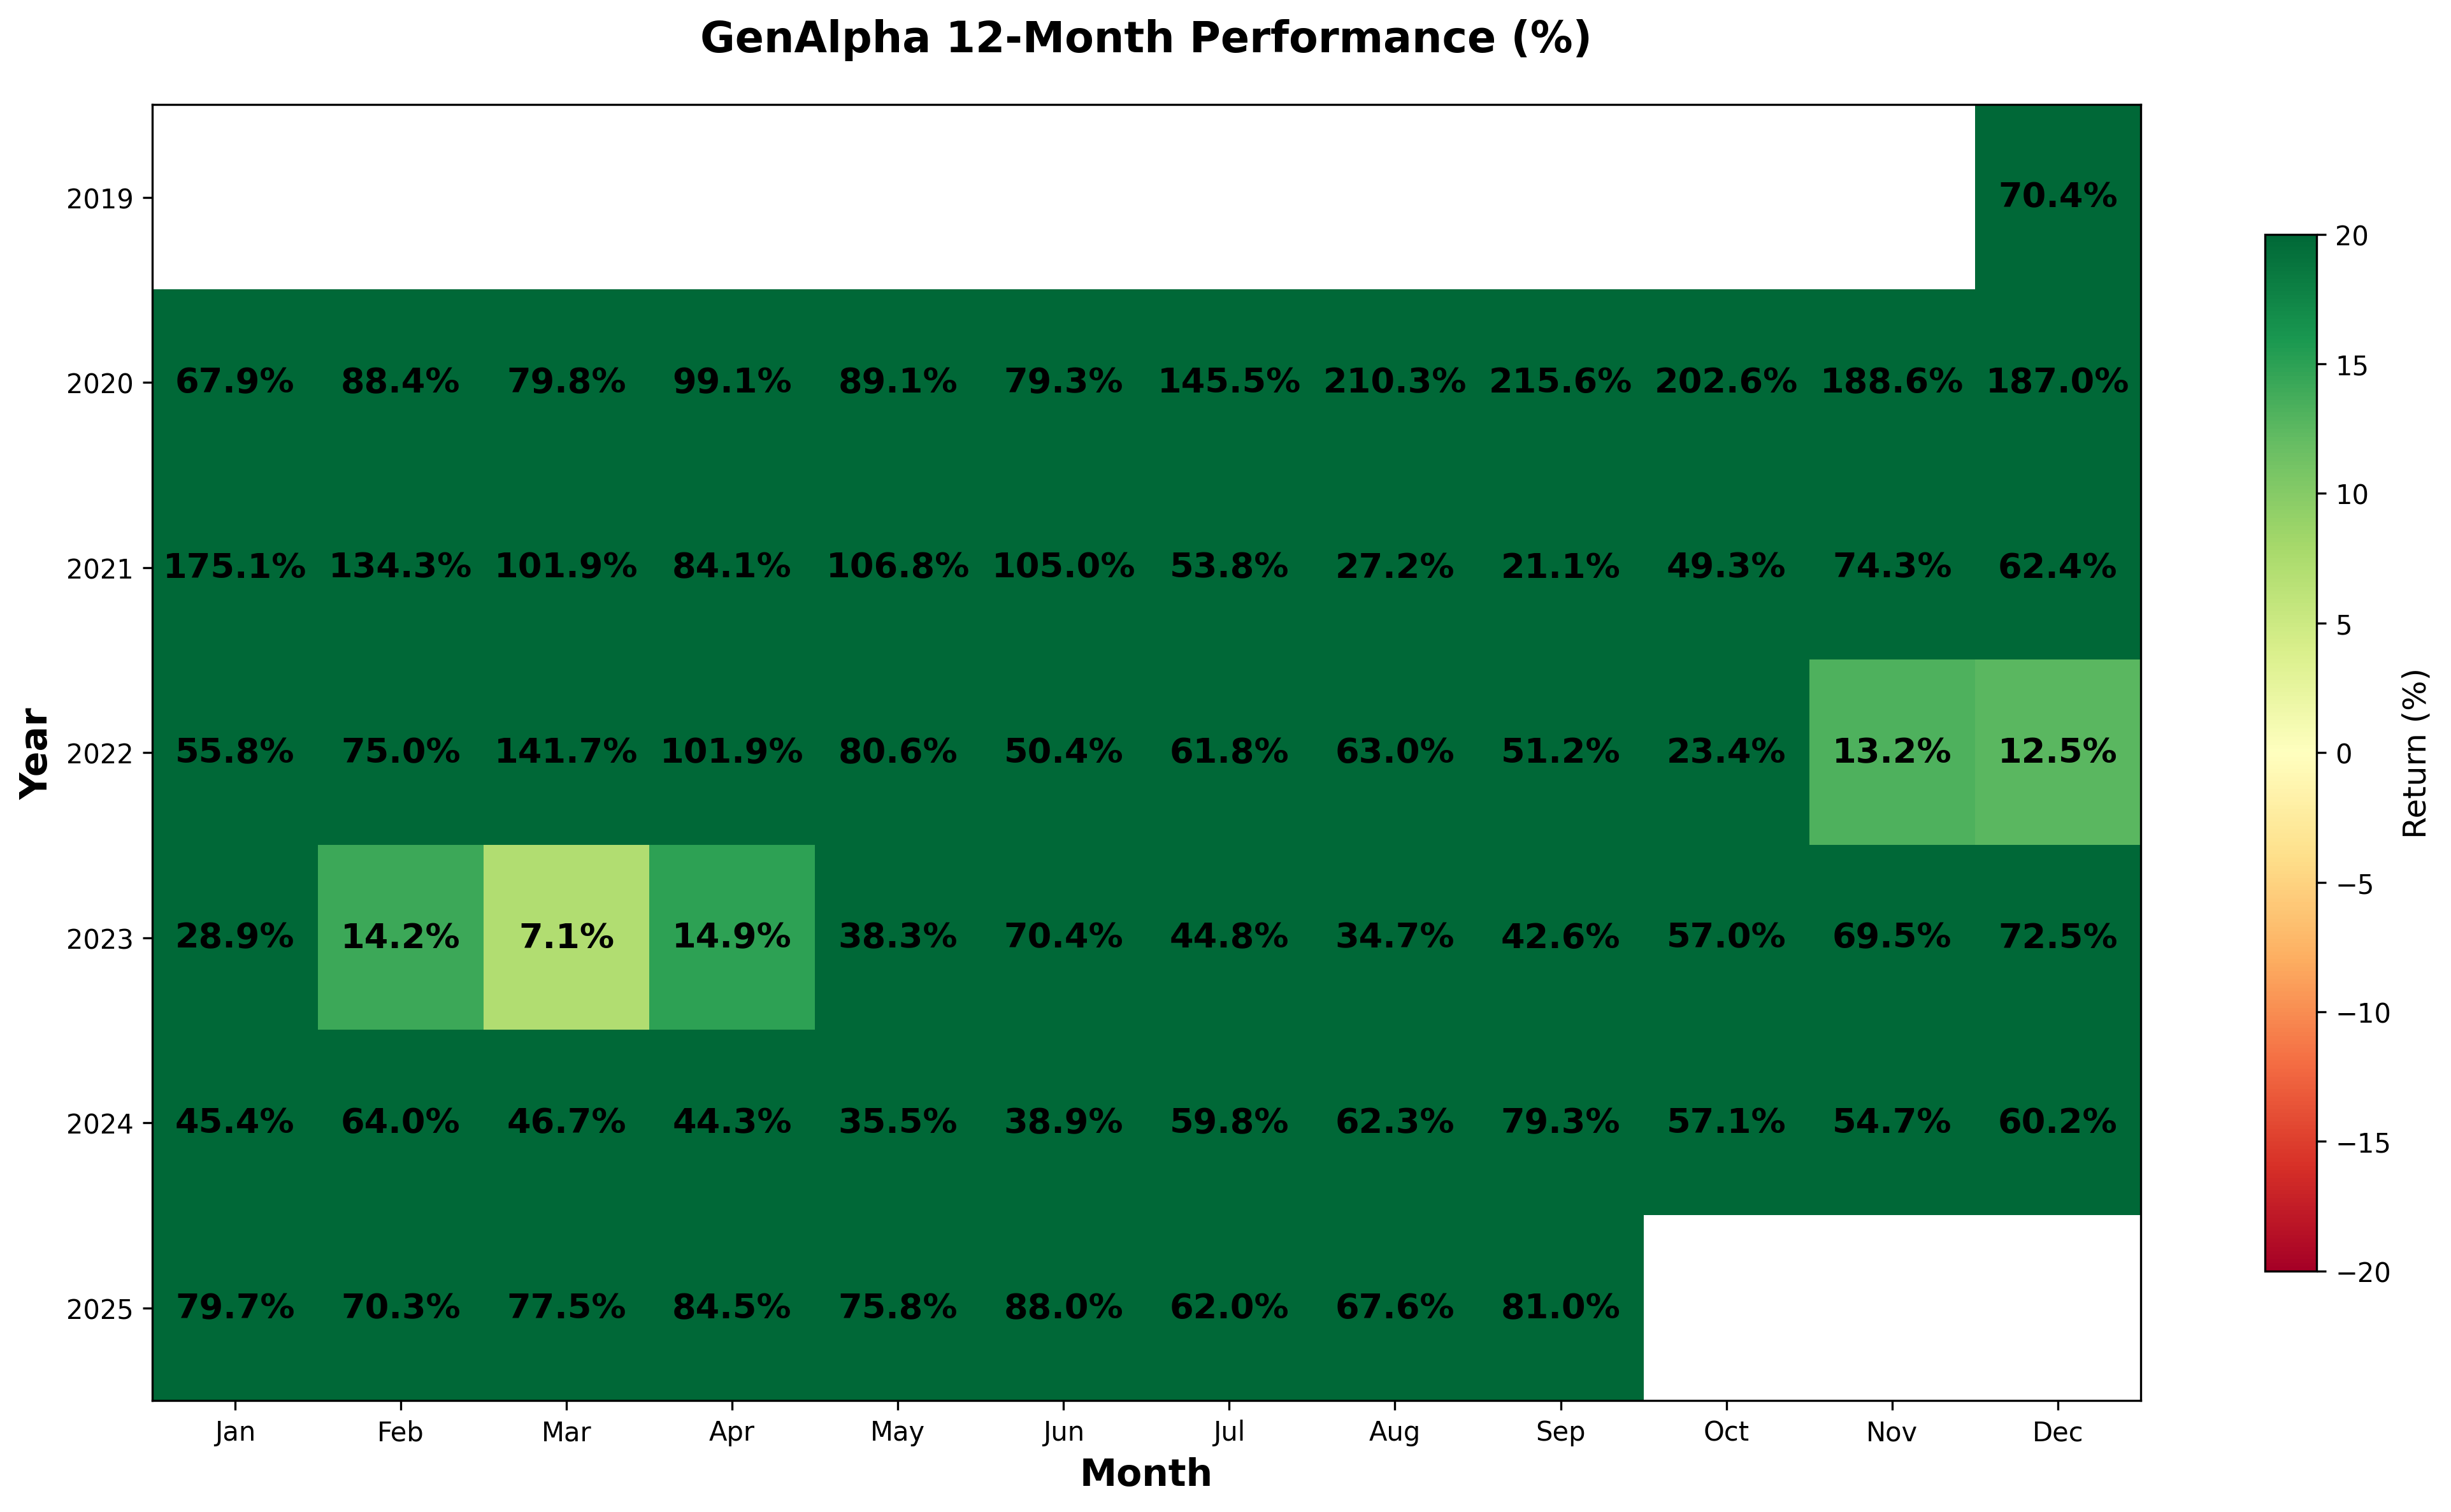
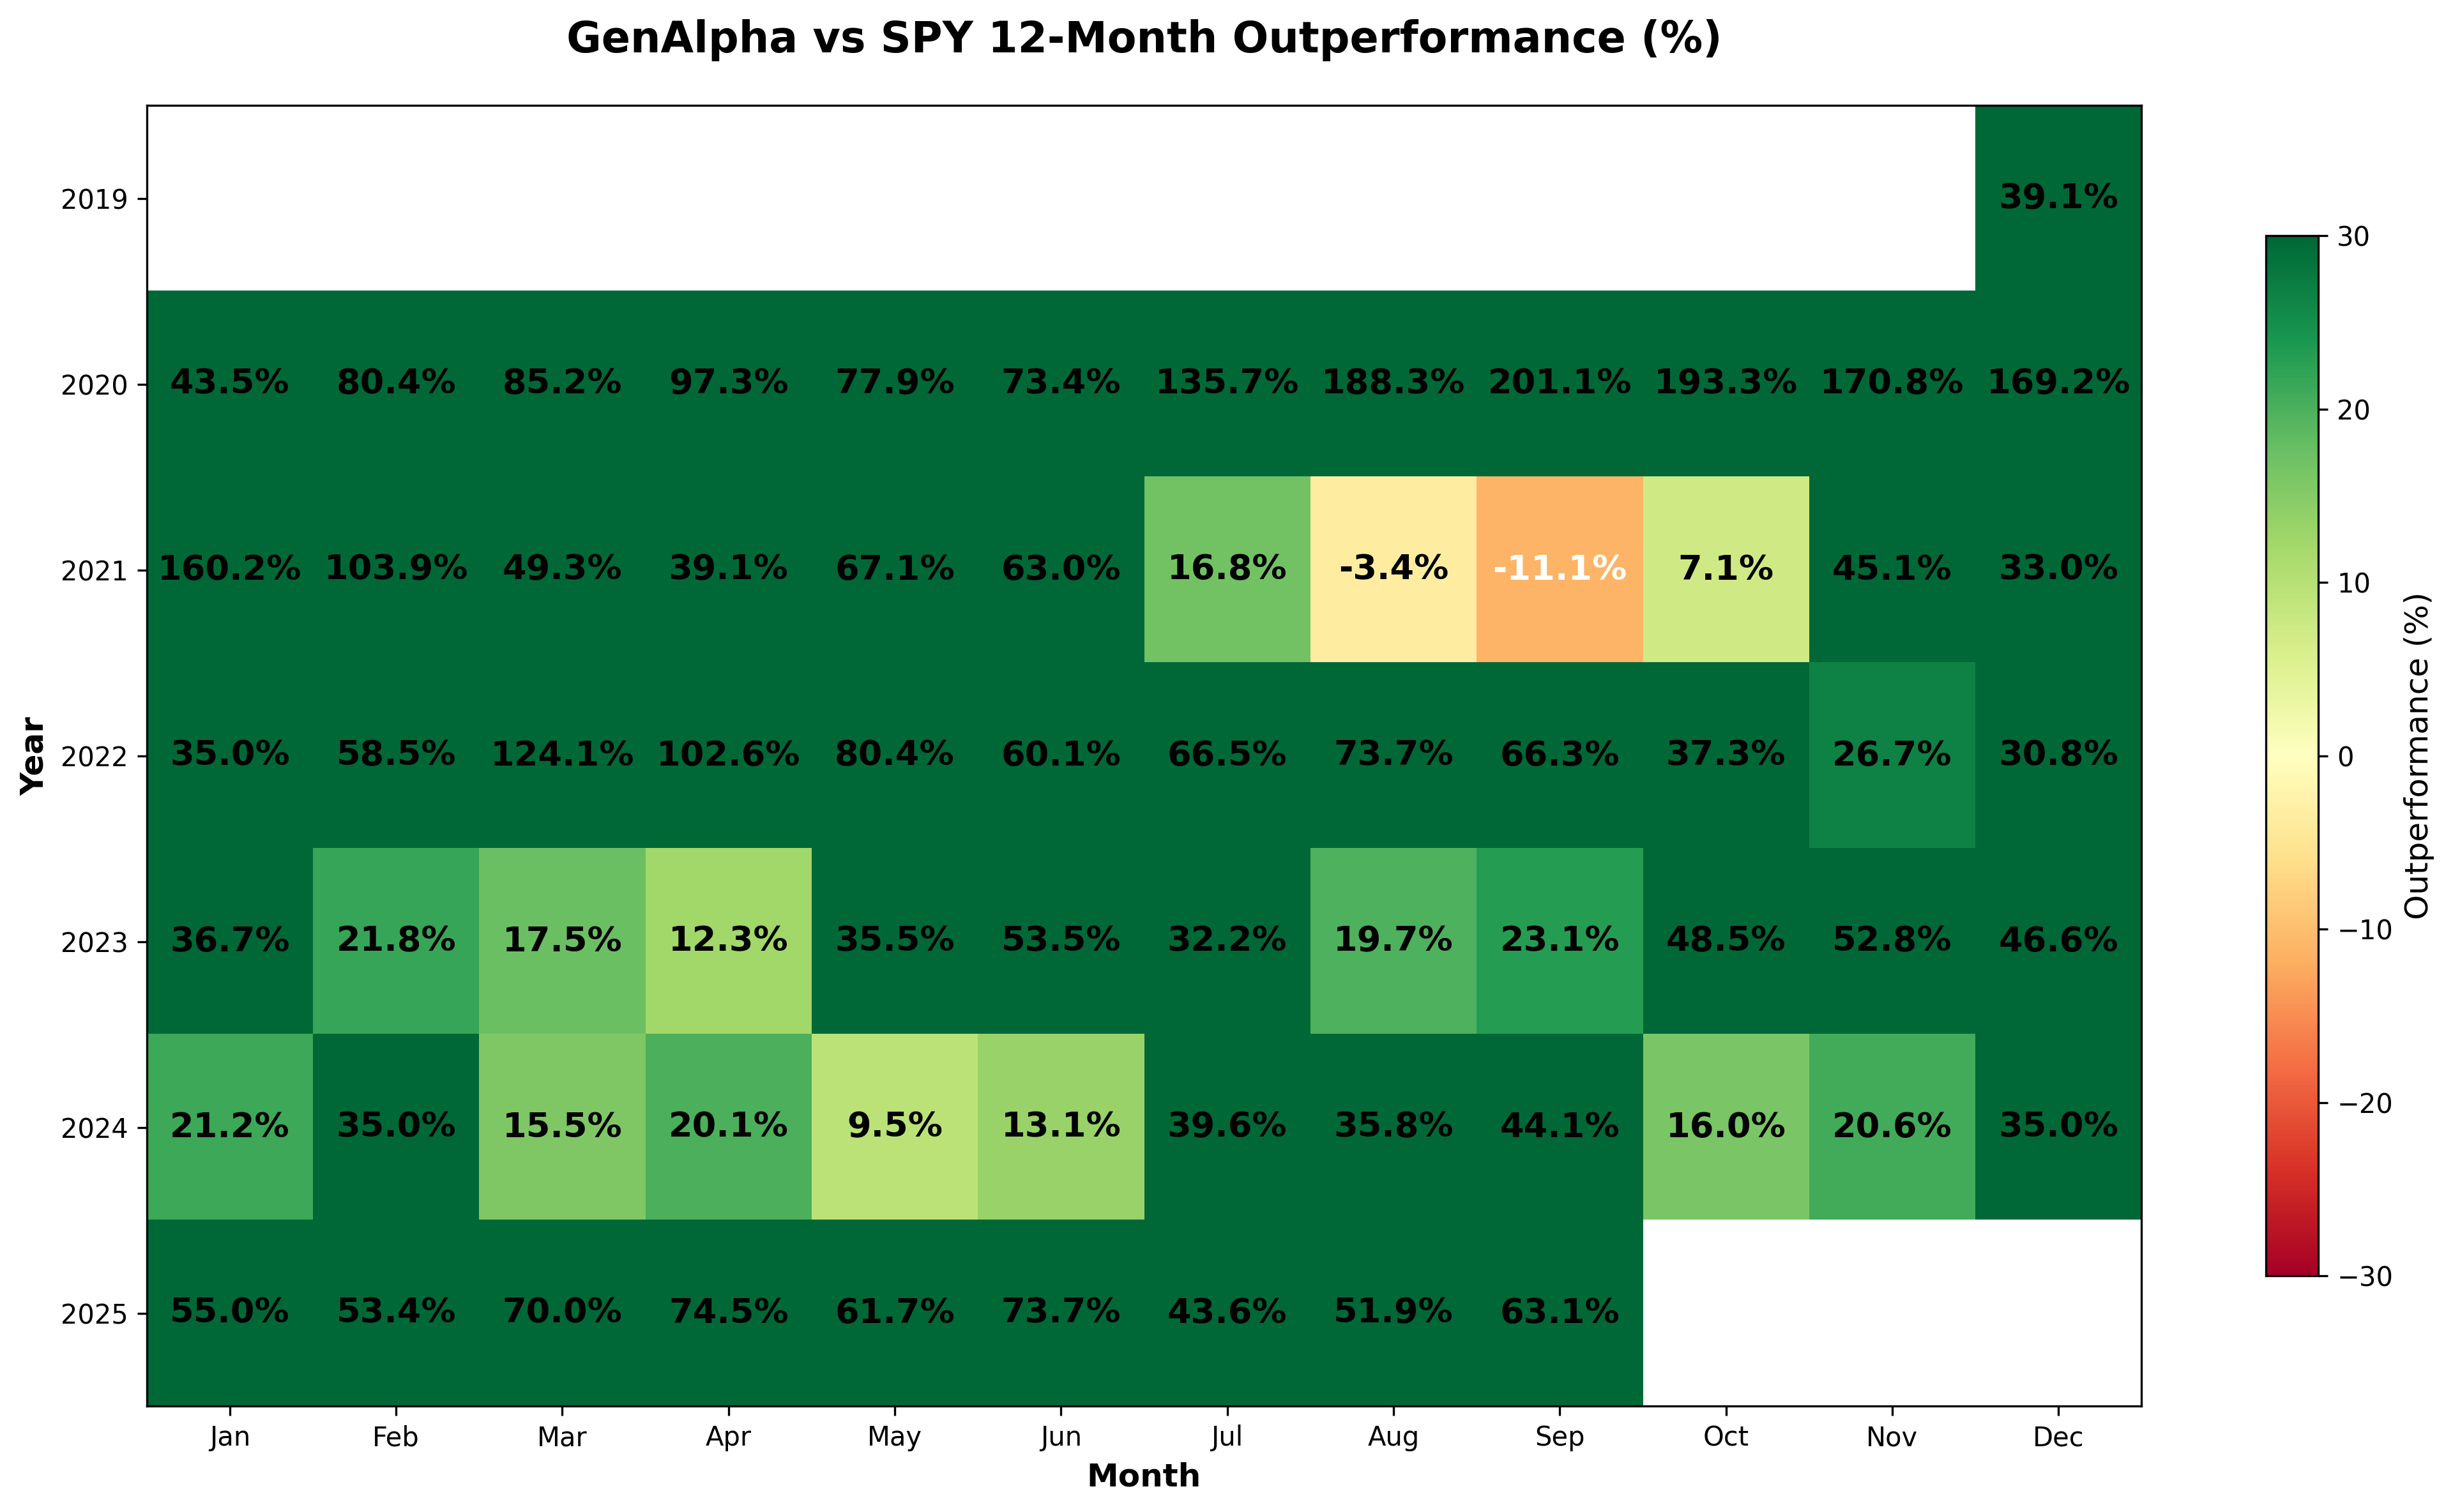
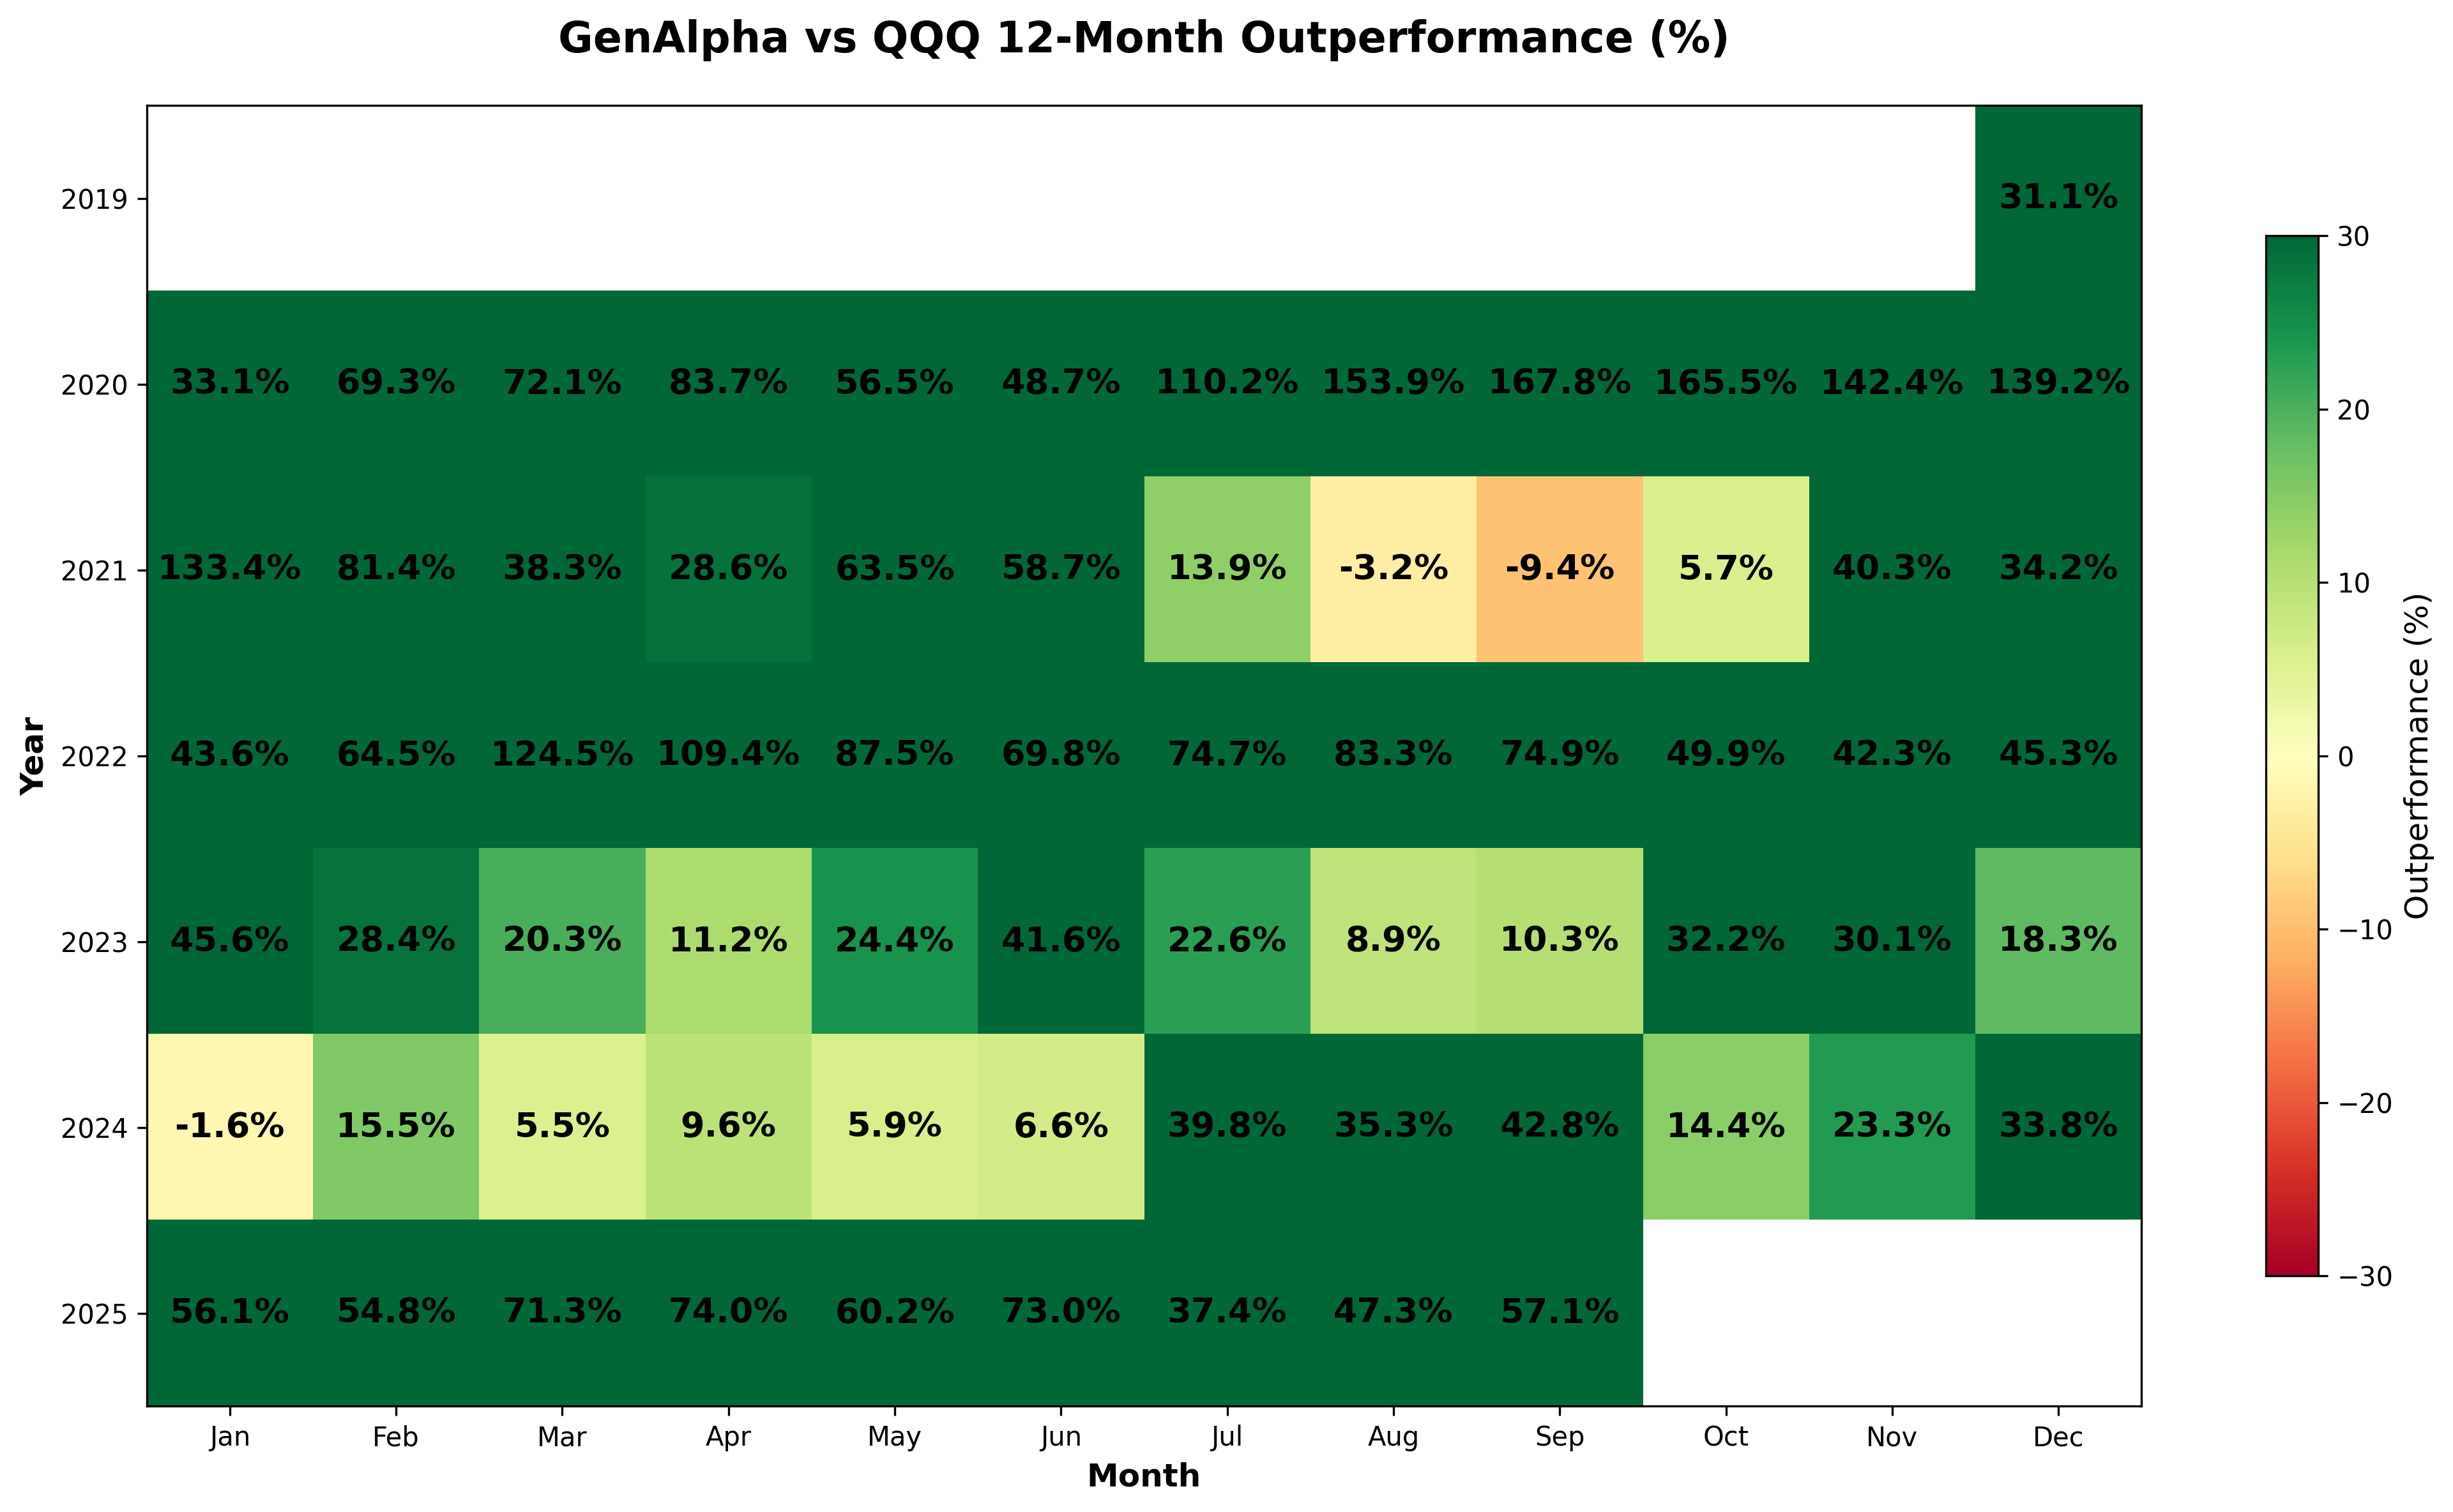
GenAlpha - 12-Month Performance Analysis
Click on the individual image to enlarge
How to Read These Charts: The individual portfolio charts show 12-month returns for each strategy. The comparison charts (GenAlpha vs Other Portfolio) display the difference in percentage returns between GenAlpha and the other portfolio. A positive number indicates GenAlpha performed better, while a negative number indicates the other portfolio performed better.
SPY
QQQ
GenAlpha
GenAlpha vs SPY
GenAlpha vs QQQ
Performance results from January 2019 through December 2025 are based on backtested data. 2026 results through May 31, 2026 reflect actual signals sent to subscribers. Past performance does not guarantee future results.
Ready to Take the Next Step?
Start your algorithmic trading journey with our proven GenAlpha signals to achieve your financial goals.